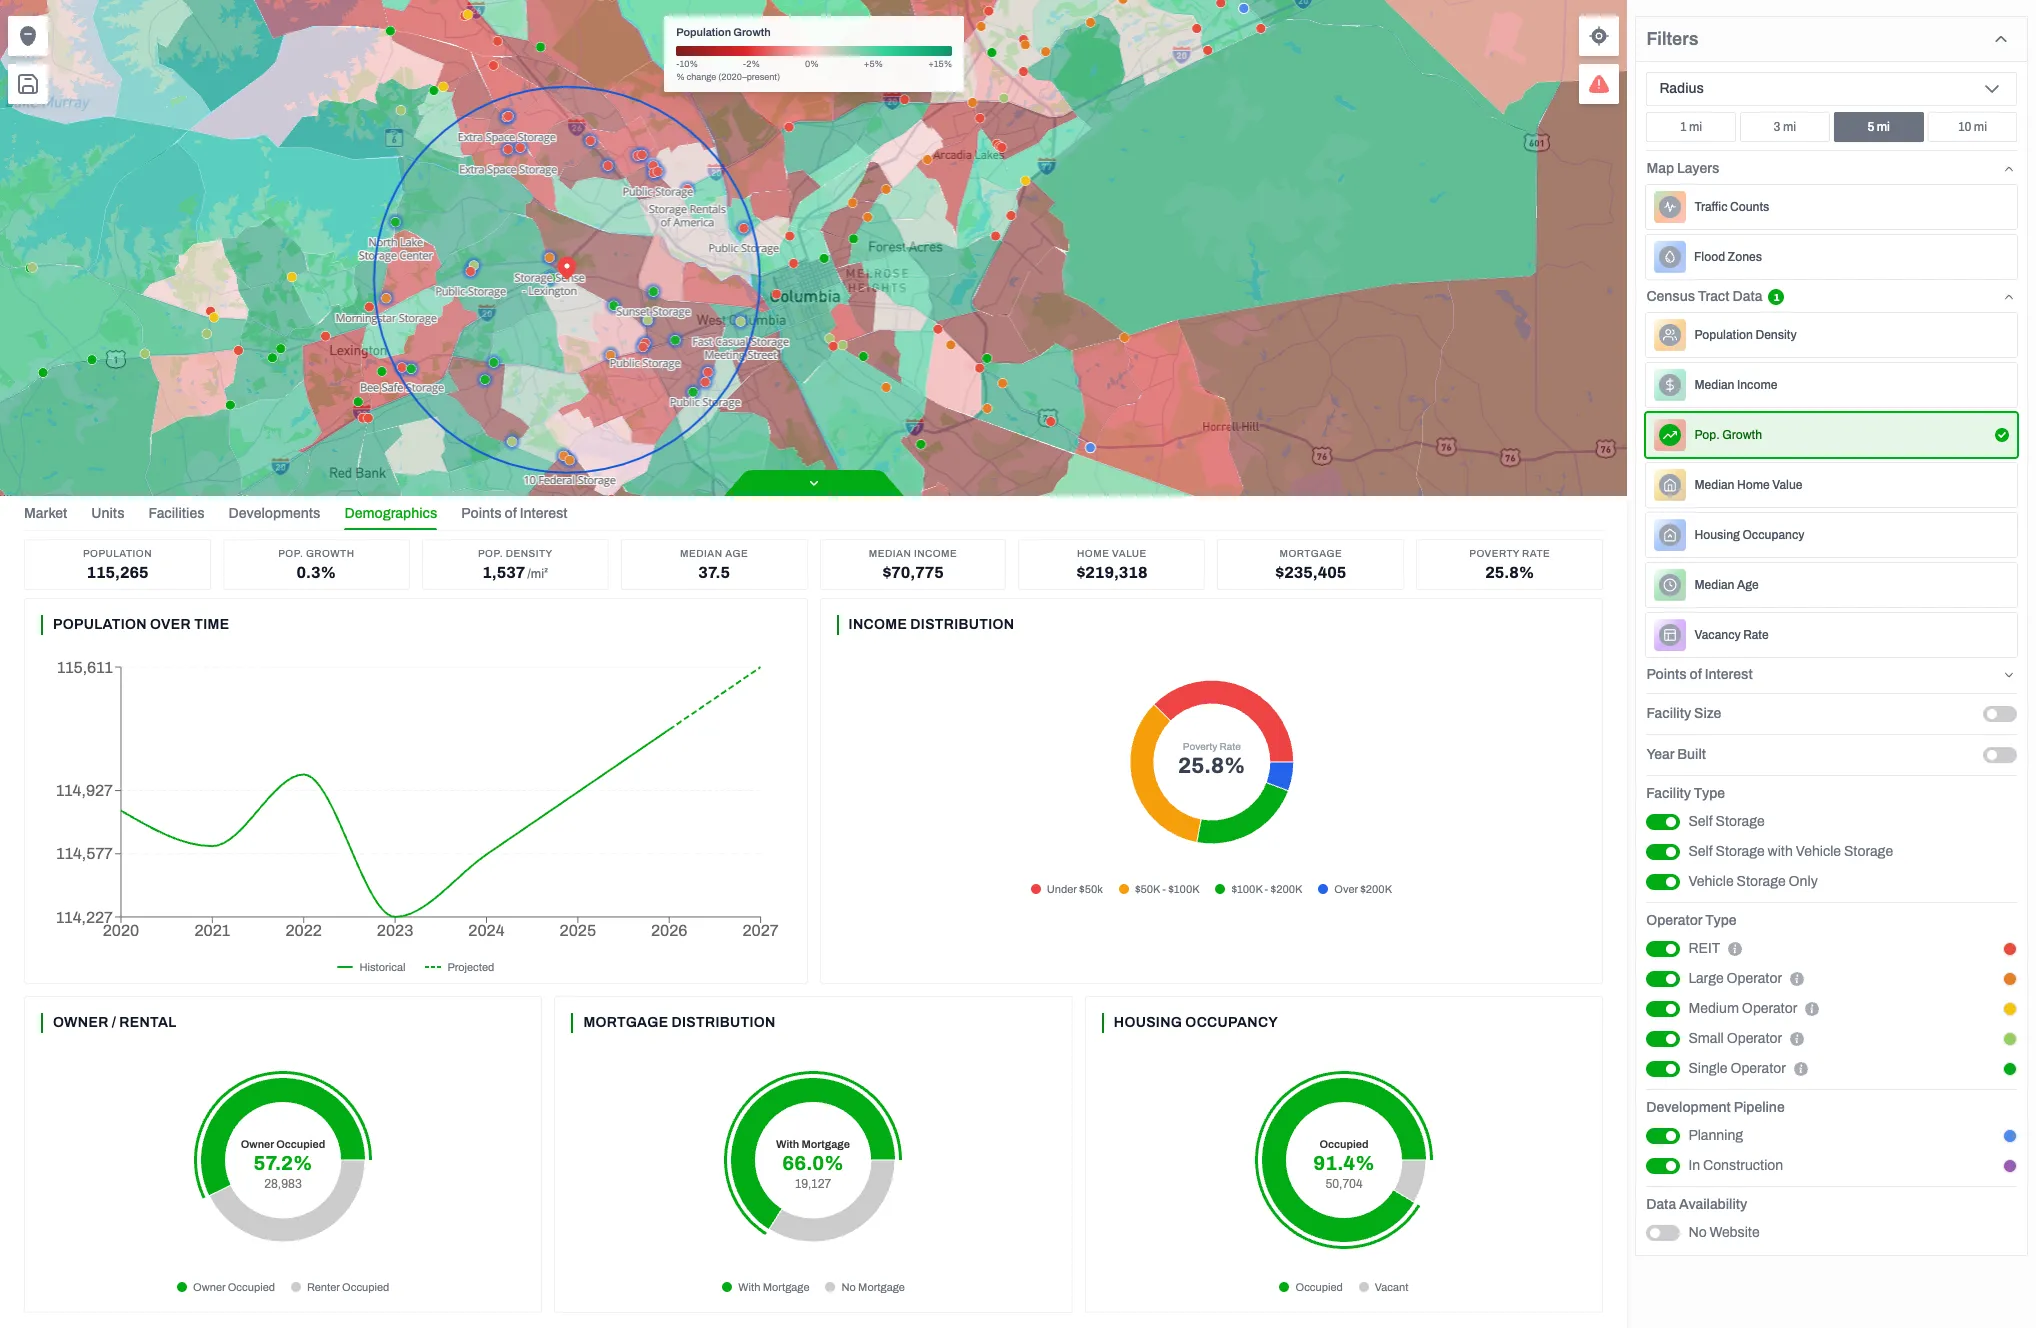
Demographics Insights
Powered by the latest US Census Demographics and tract-level statistics. Get hyper-local insights into income, density, housing occupancy, and age patterns — all tailored to reveal high-potential self-storage markets. Identify neighborhoods where demand drivers like limited on-site storage, frequent moves, and life-stage transitions create strong opportunities for new facilities or lease-up acceleration.
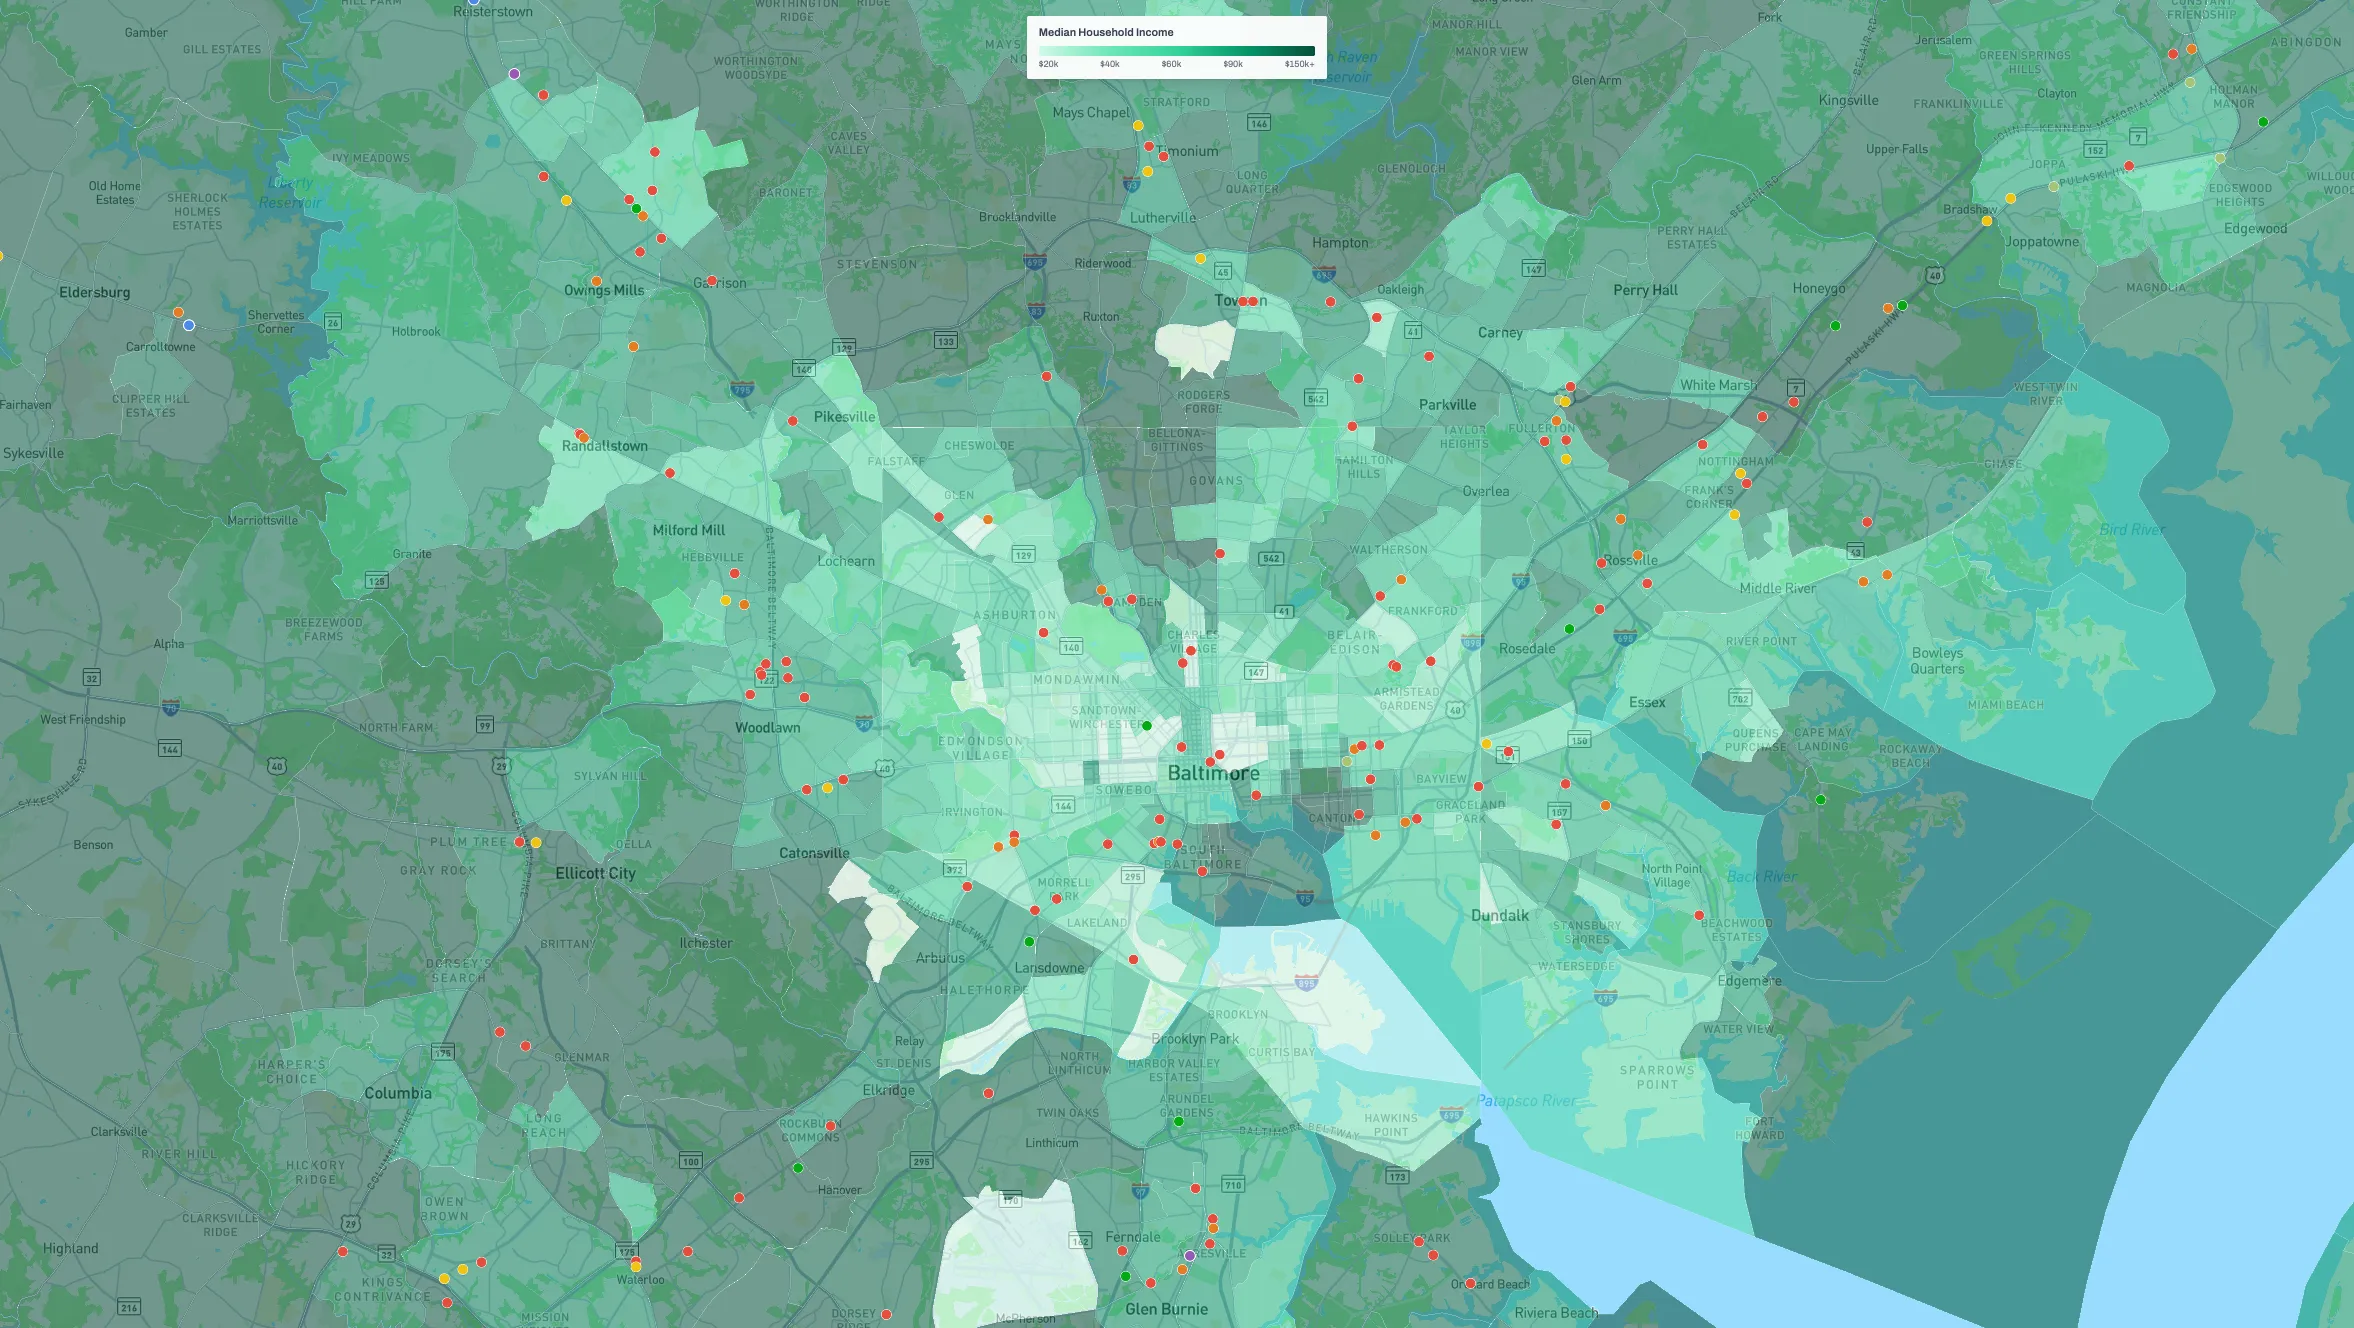
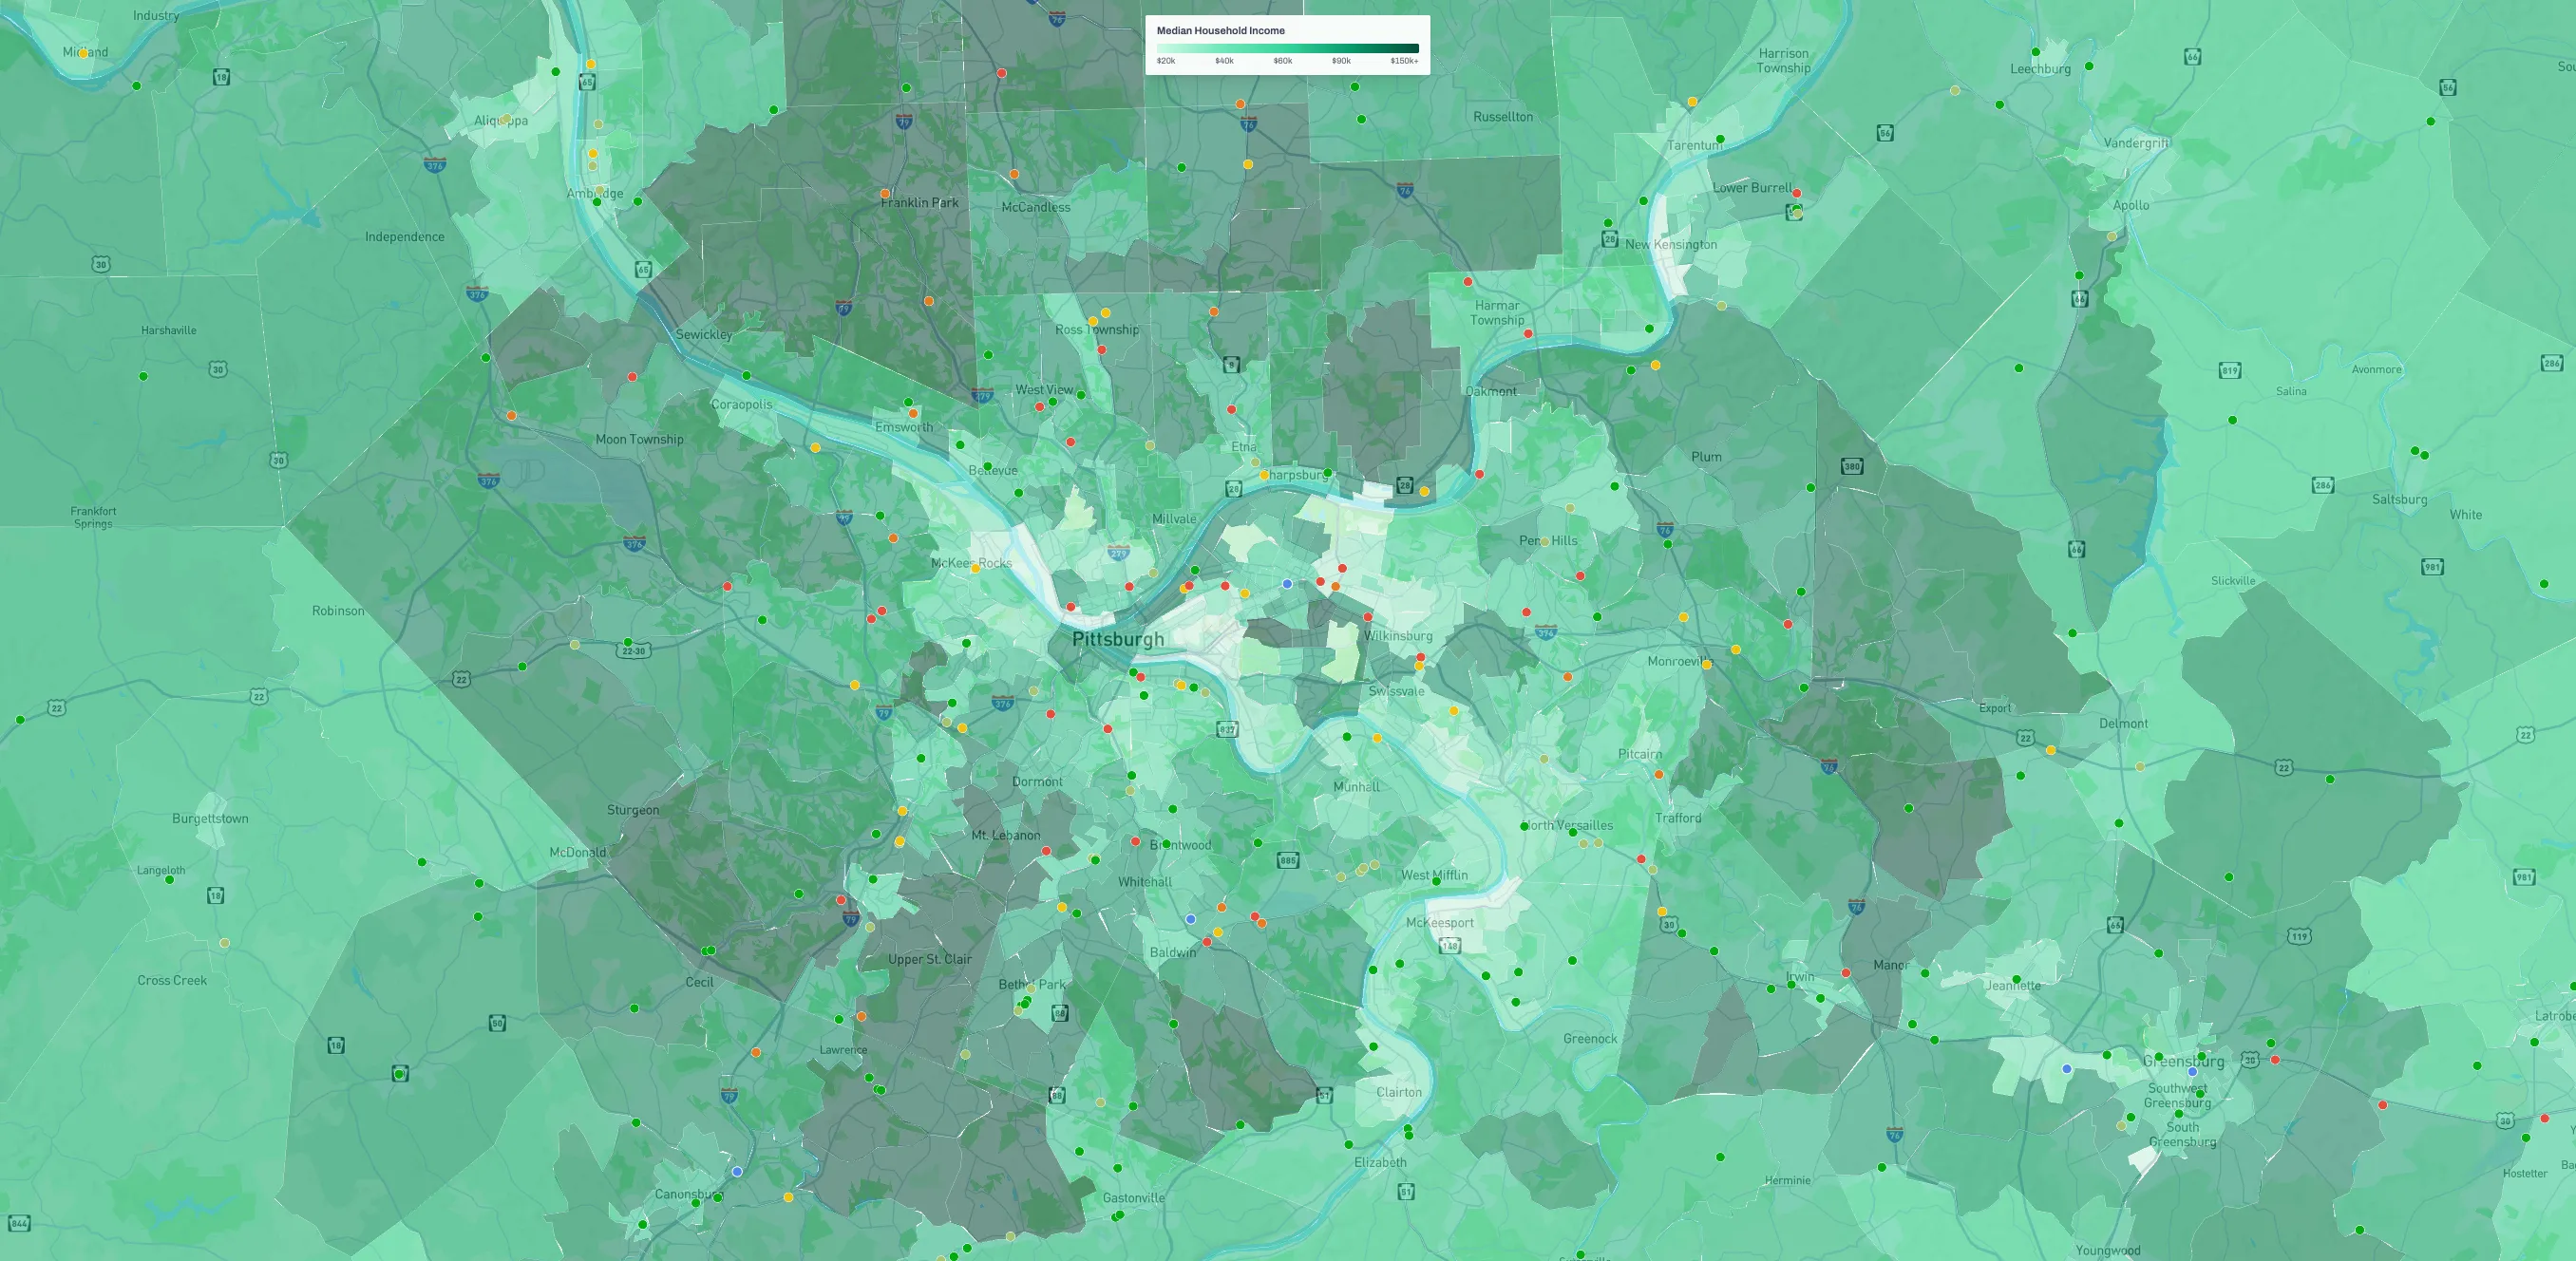
Median Household Income
Localized analysis of purchasing power and disposable income indices across micro-neighborhoods. Higher-income areas often correlate with greater demand for climate-controlled and larger-unit self-storage, as residents seek convenient solutions for seasonal items, recreational gear, and business inventory.
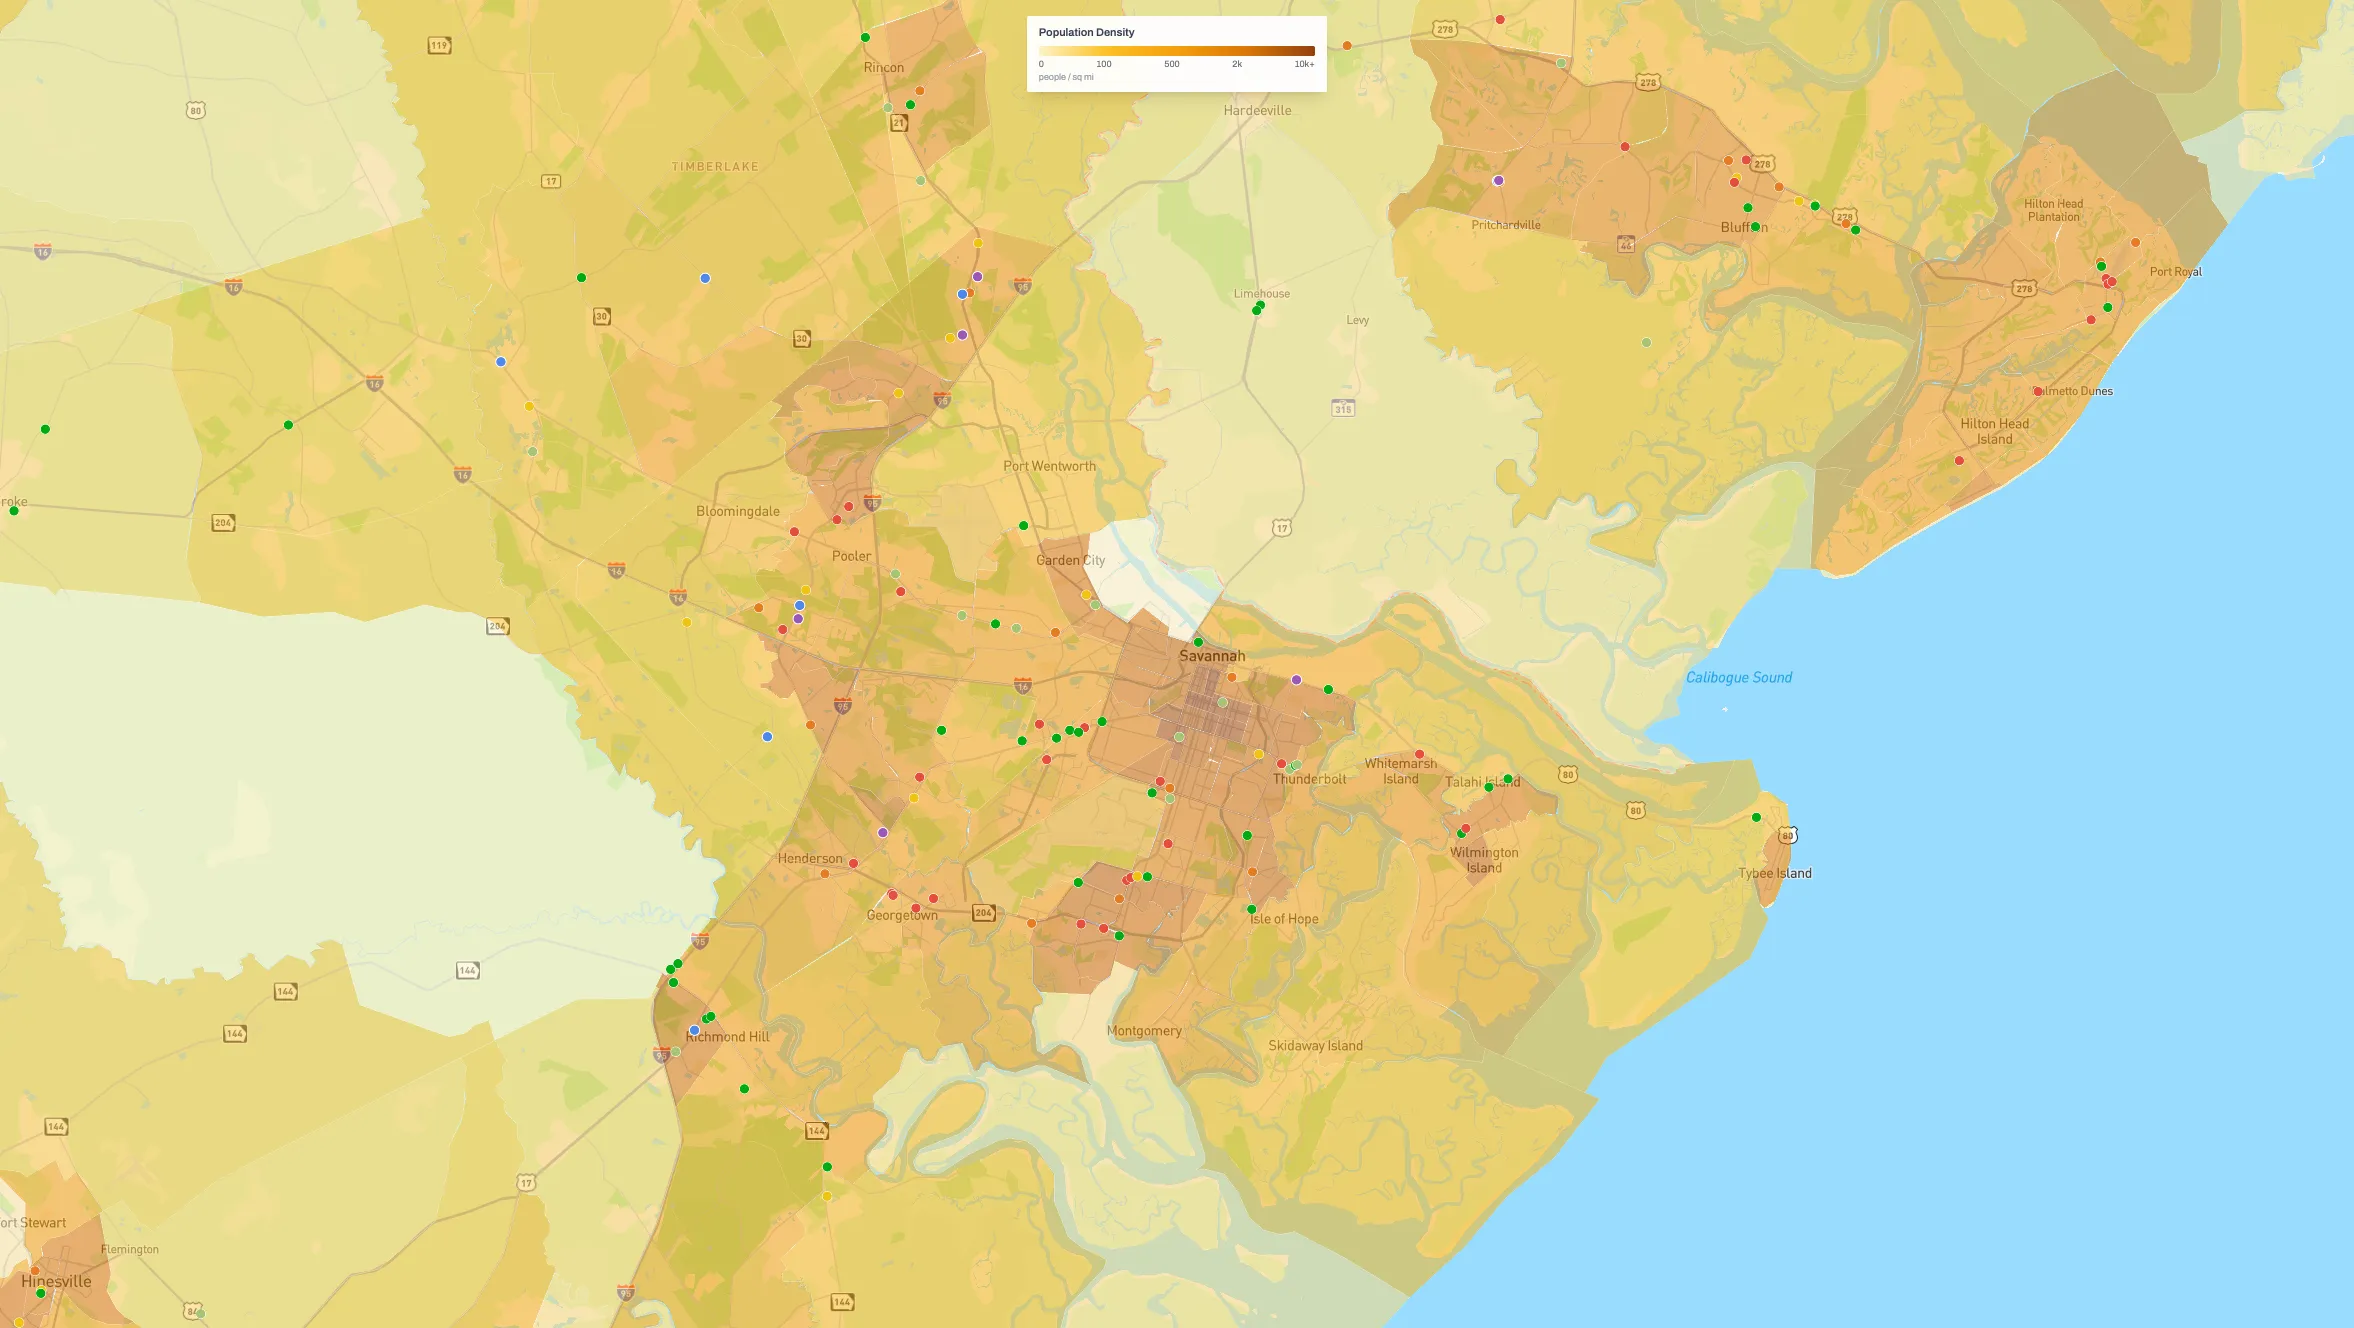
Population Density
Identify demand hotspots with tract level demographics. Densely populated micro-markets frequently experience higher self-storage absorption rates due to limited on-site storage in apartments and townhomes, making density a key indicator of leasing velocity and long-term occupancy potential.
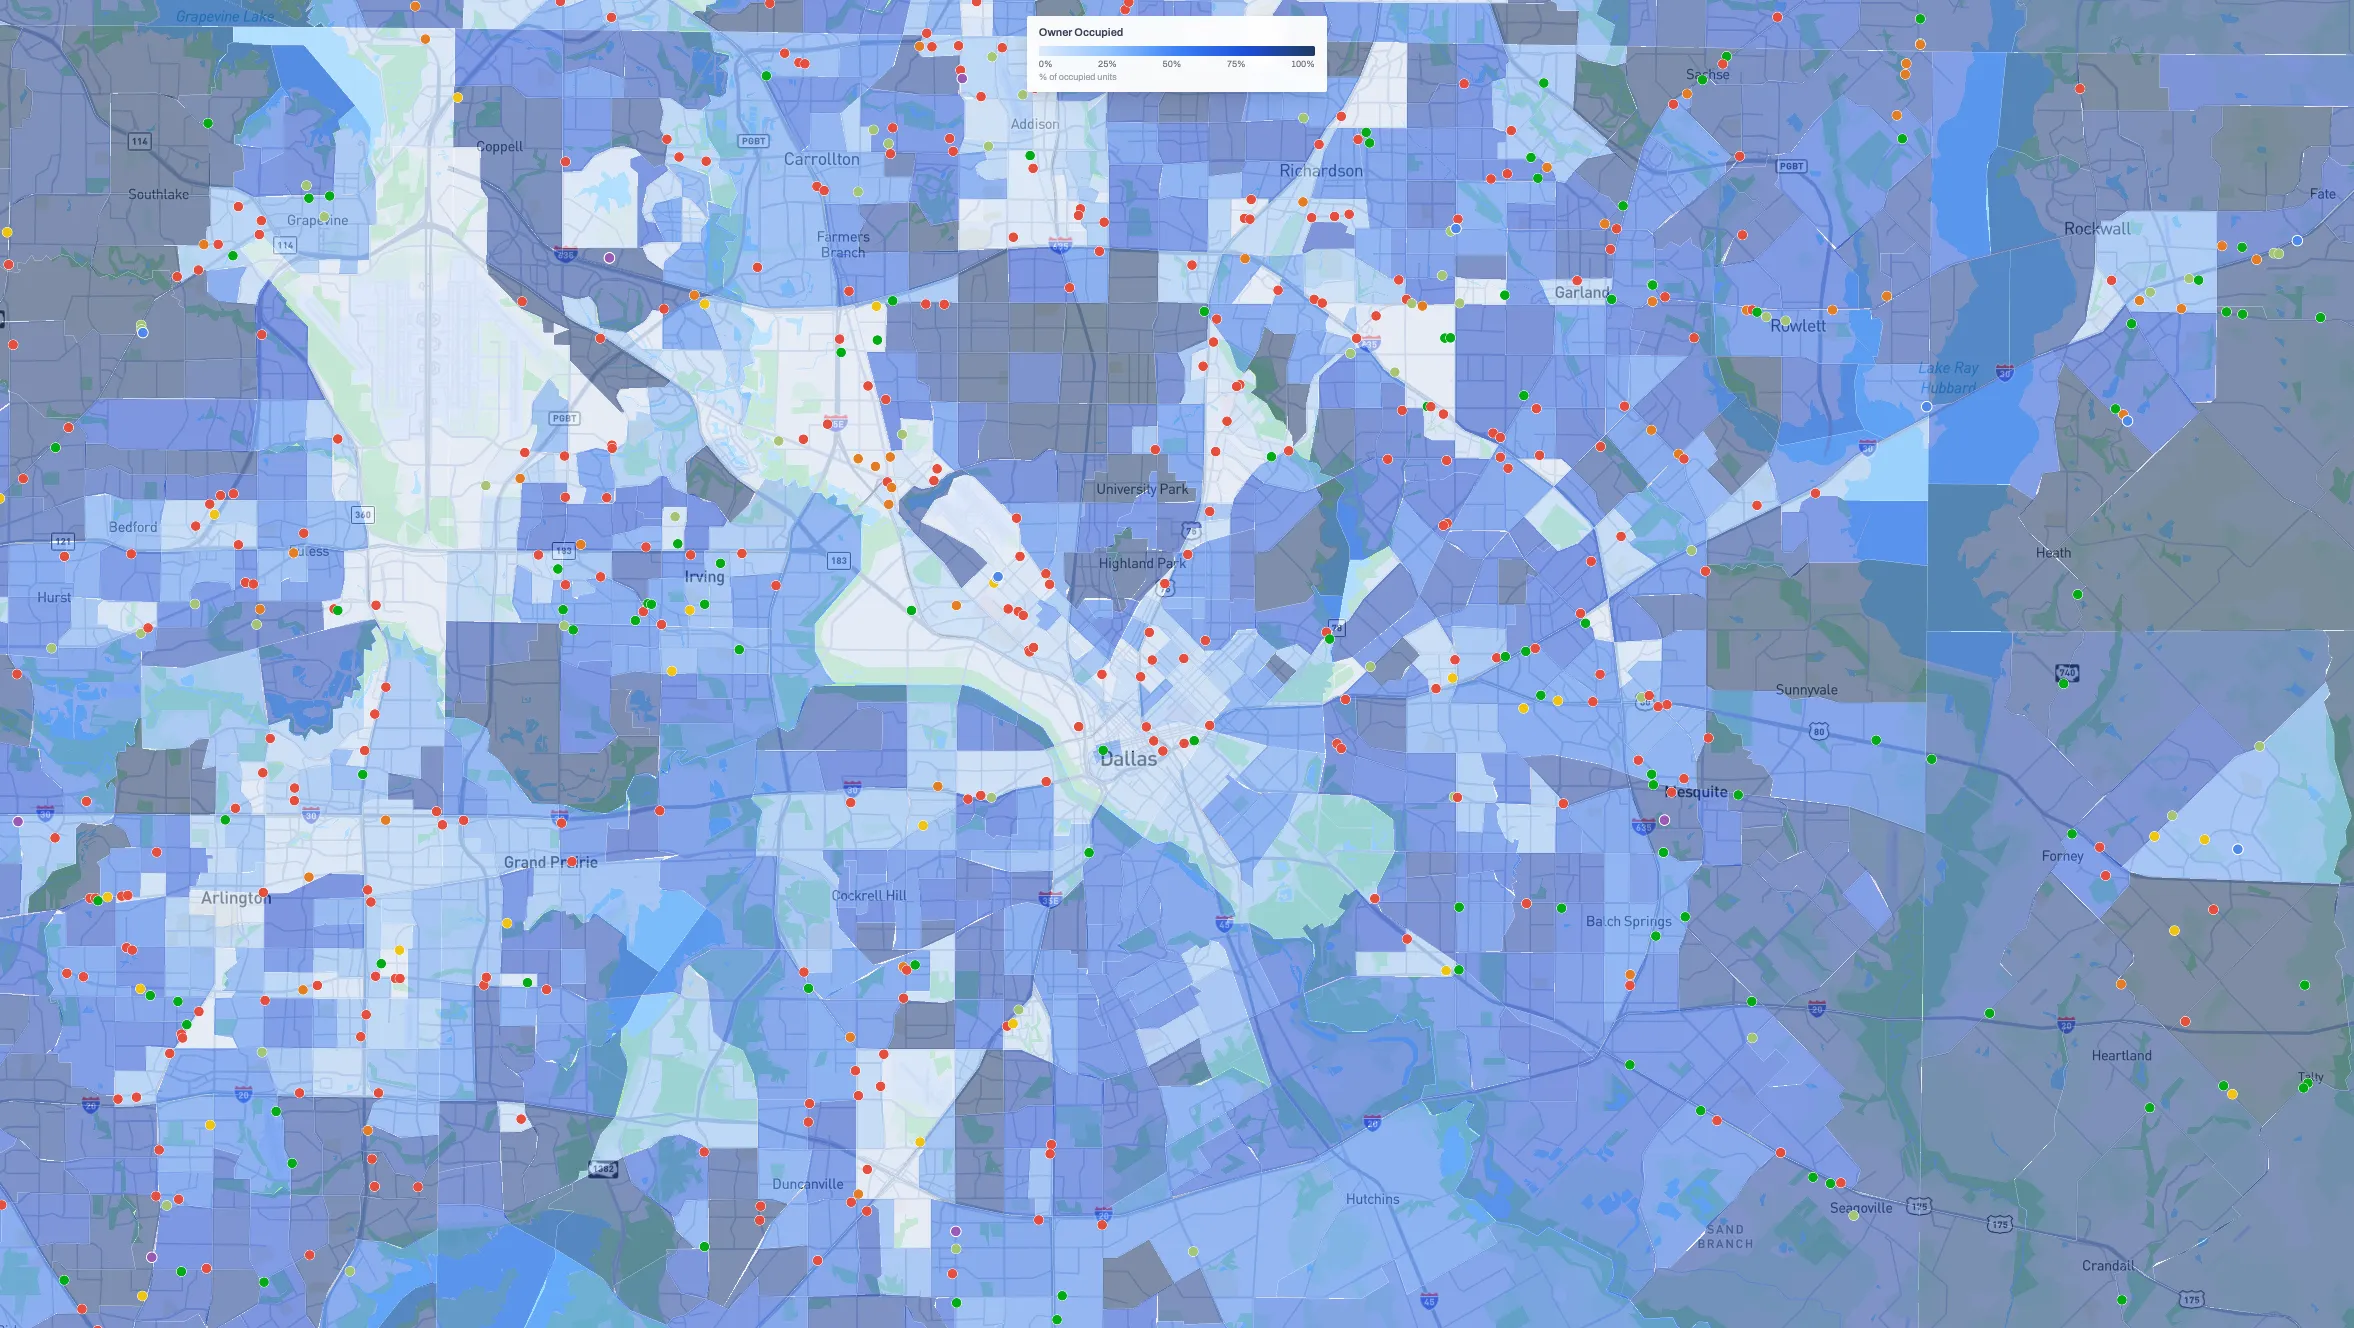
Housing Occupancy
Track owner-occupied vs renter-occupied housing ratios to understand local demand drivers for self-storage. Areas with higher renter-occupied ratios typically generate stronger self-storage demand, as renters often lack garage or basement space and frequently move, creating both short-term and long-term storage needs.
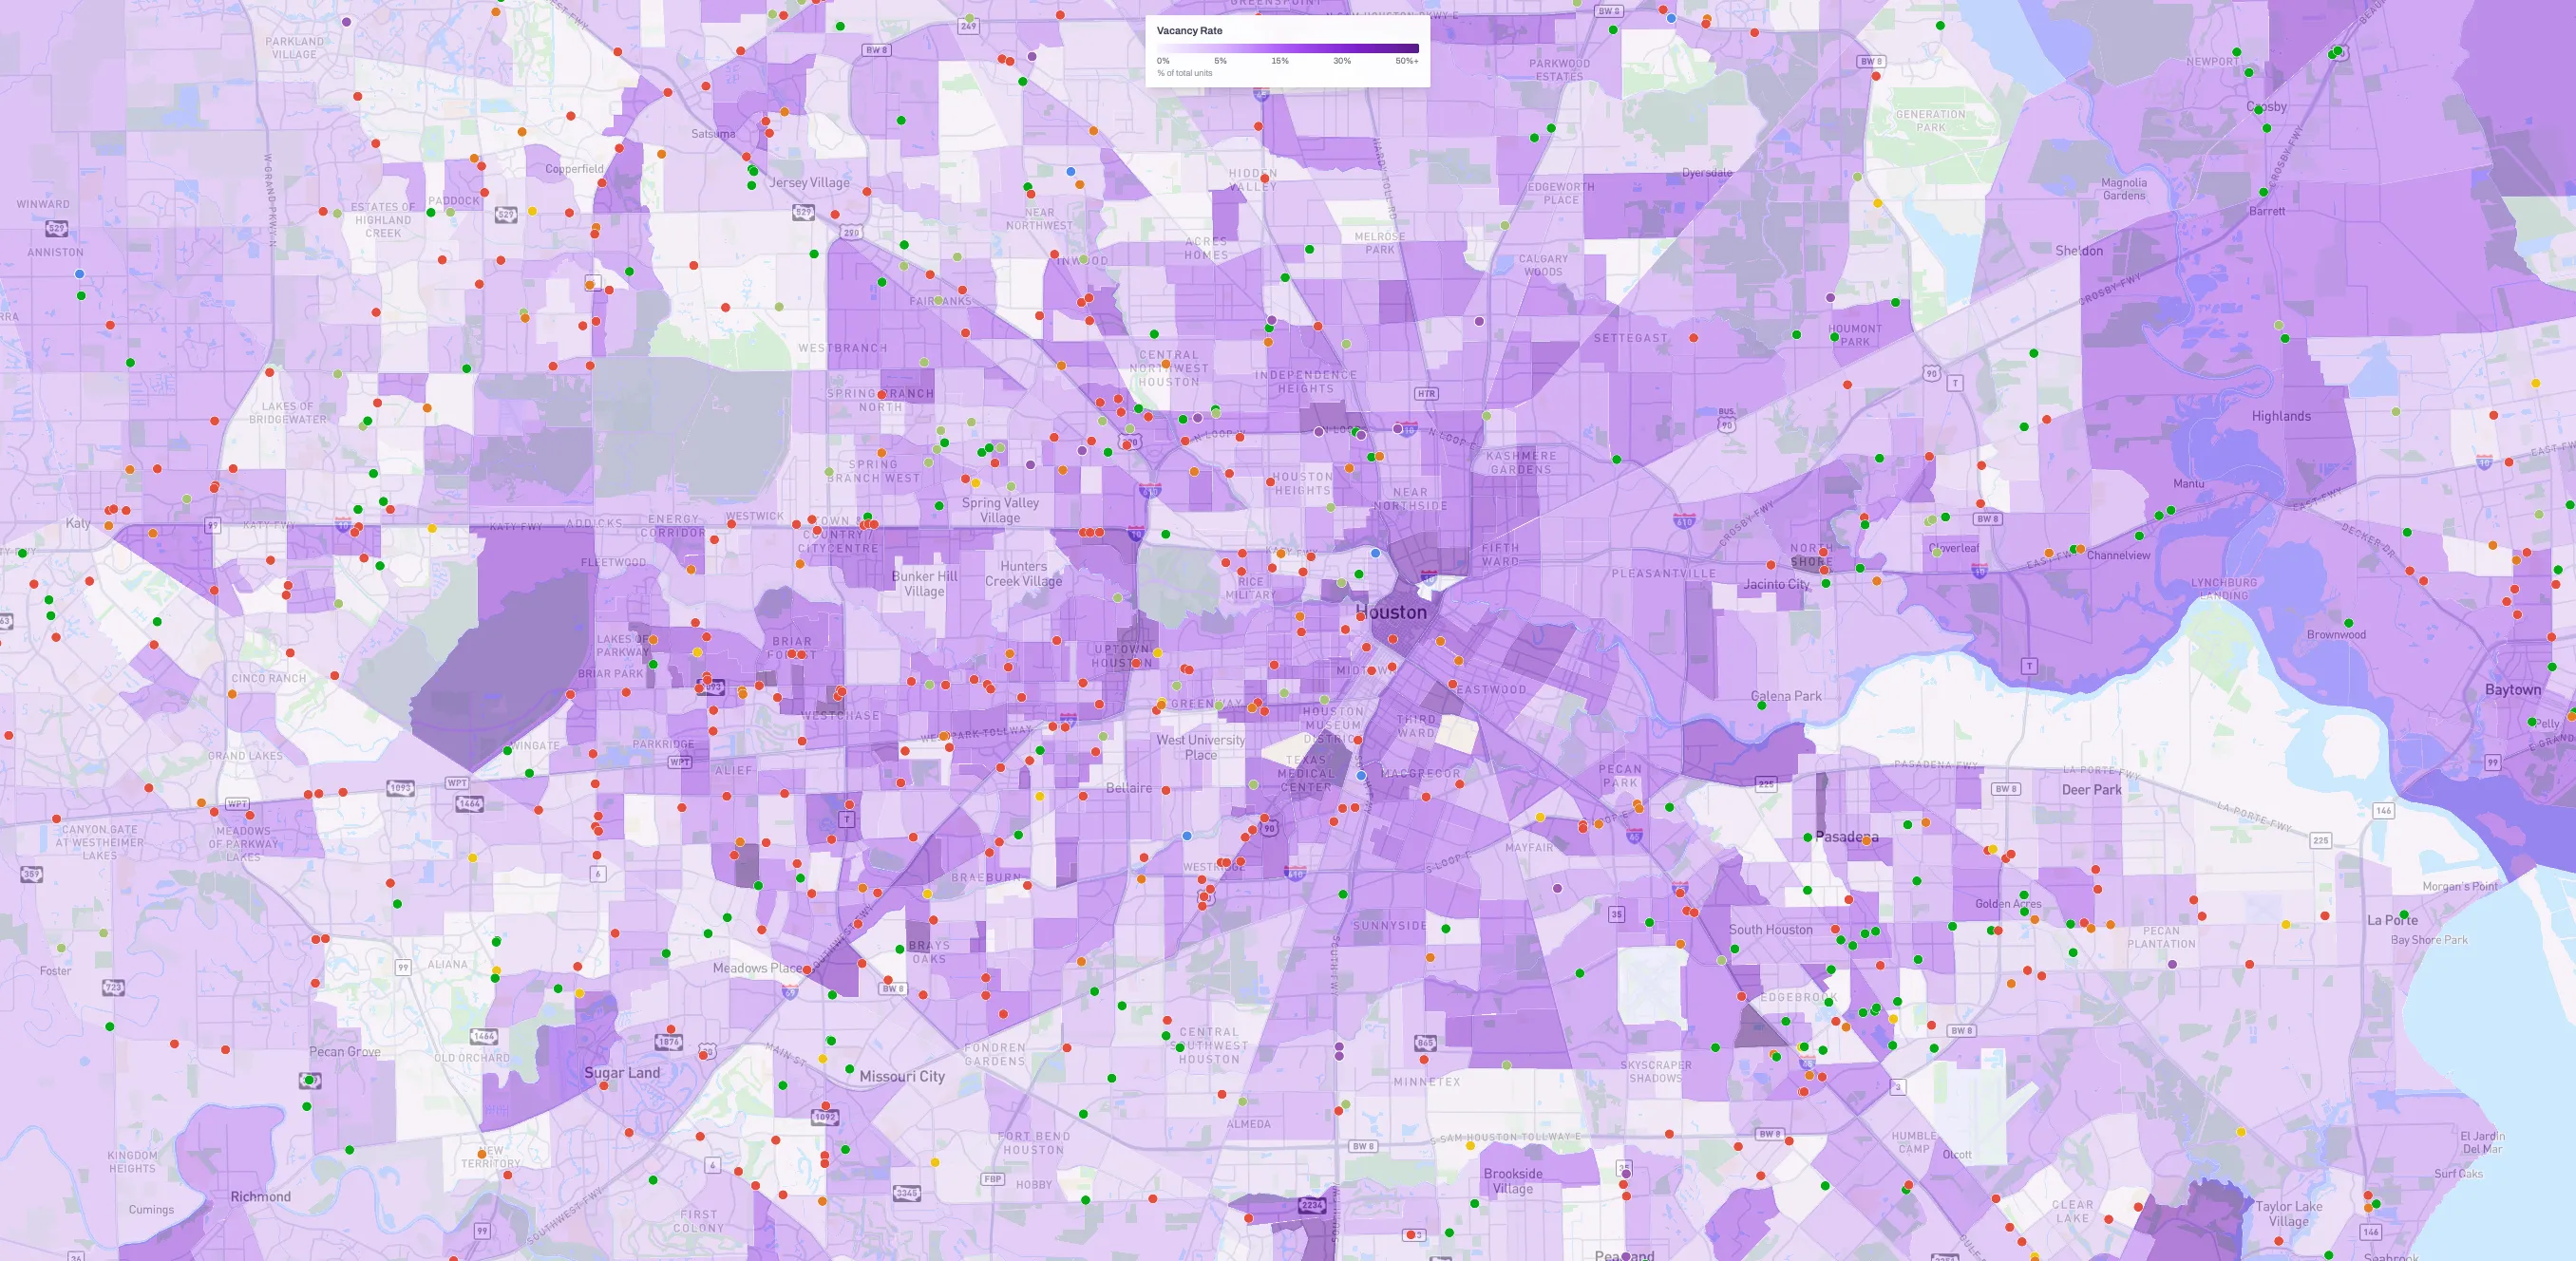
Vacancy Rate
Monitor residential vacancy rates to gauge population stability and potential self-storage demand shifts. Rising residential vacancies can signal softening local demand or tenant turnover, while low vacancy often points to a stable or growing population that supports consistent self-storage utilization.
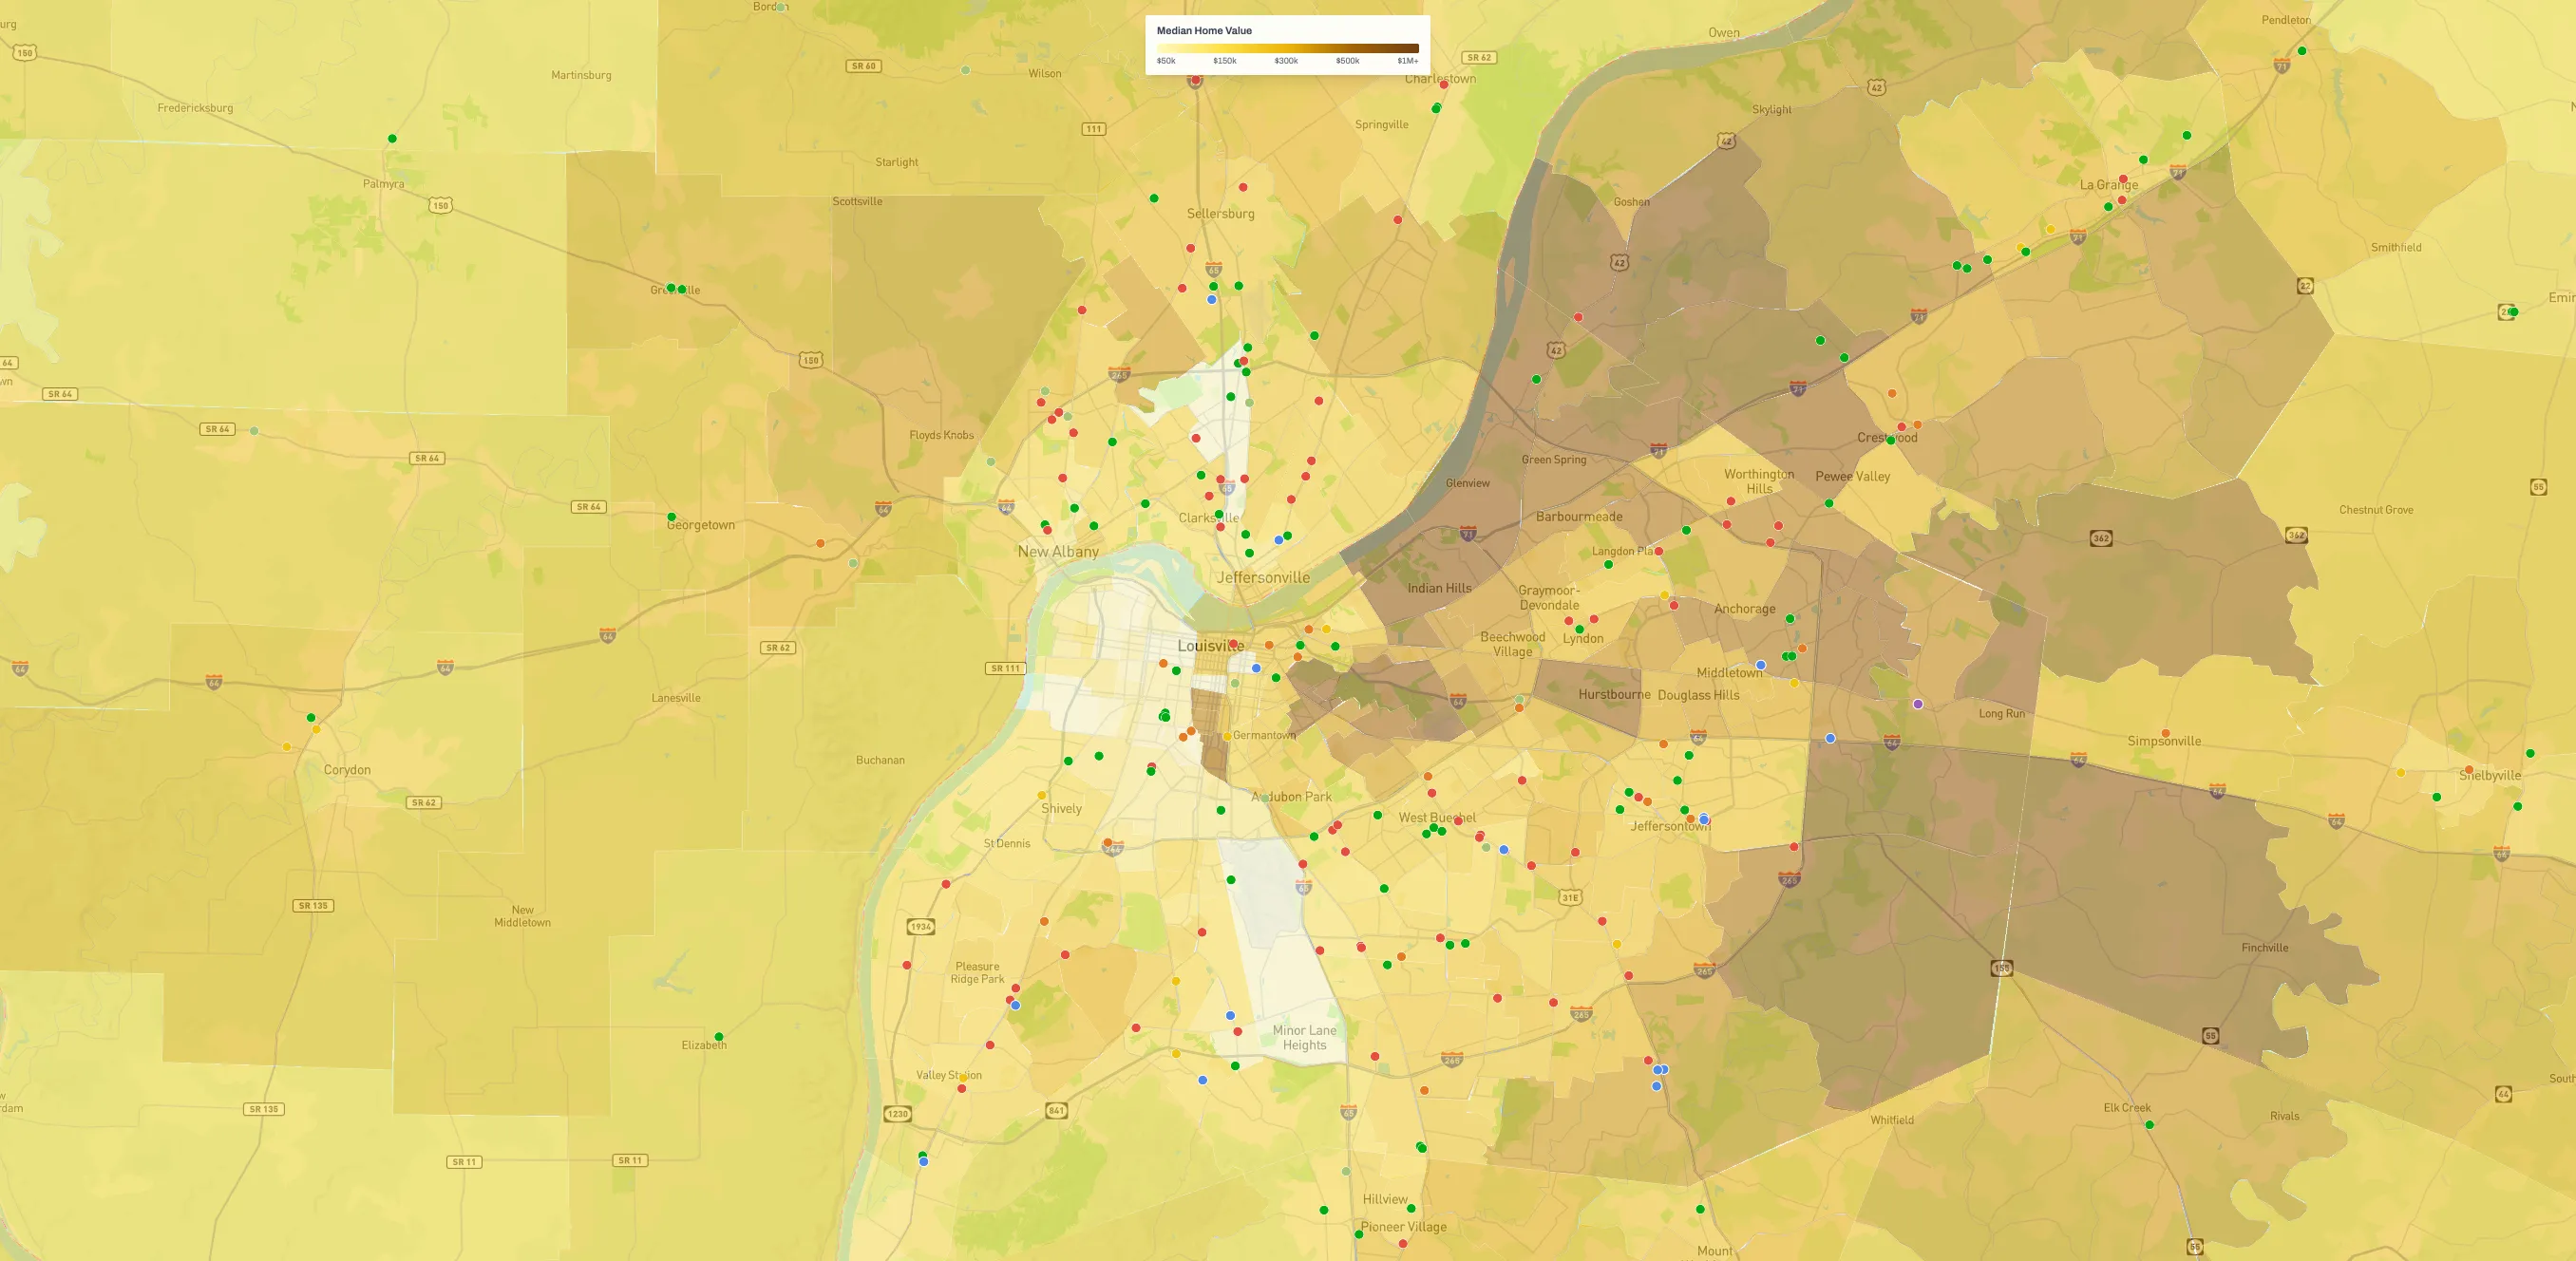
Median Home Value
Assess local real estate values to understand the economic profile and investment potential of surrounding neighborhoods. Neighborhoods with rising median home values often attract homeowners who downsize, renovate, or invest in second properties — all scenarios that commonly increase demand for secure, flexible self-storage solutions.
Median Age
Analyze age distribution patterns to identify markets with demographics that drive higher self-storage demand. Markets with a higher concentration of residents aged 25–45 (prime moving and life-transition years) or active retirees often show elevated self-storage needs driven by relocations, life events, and the need to store family heirlooms, recreational vehicles, or downsized household goods.
Ready to Master Your Market?
Get ahead in competitive markets and spot opportunities others miss.