A Guide to Map Layers in Storage Stats
Every market view in Storage Stats is a base map you stack layers on, from supply and demographics to building permits, demand drivers, and flood-zone overlays. A run through what each layer shows and how to combine them.
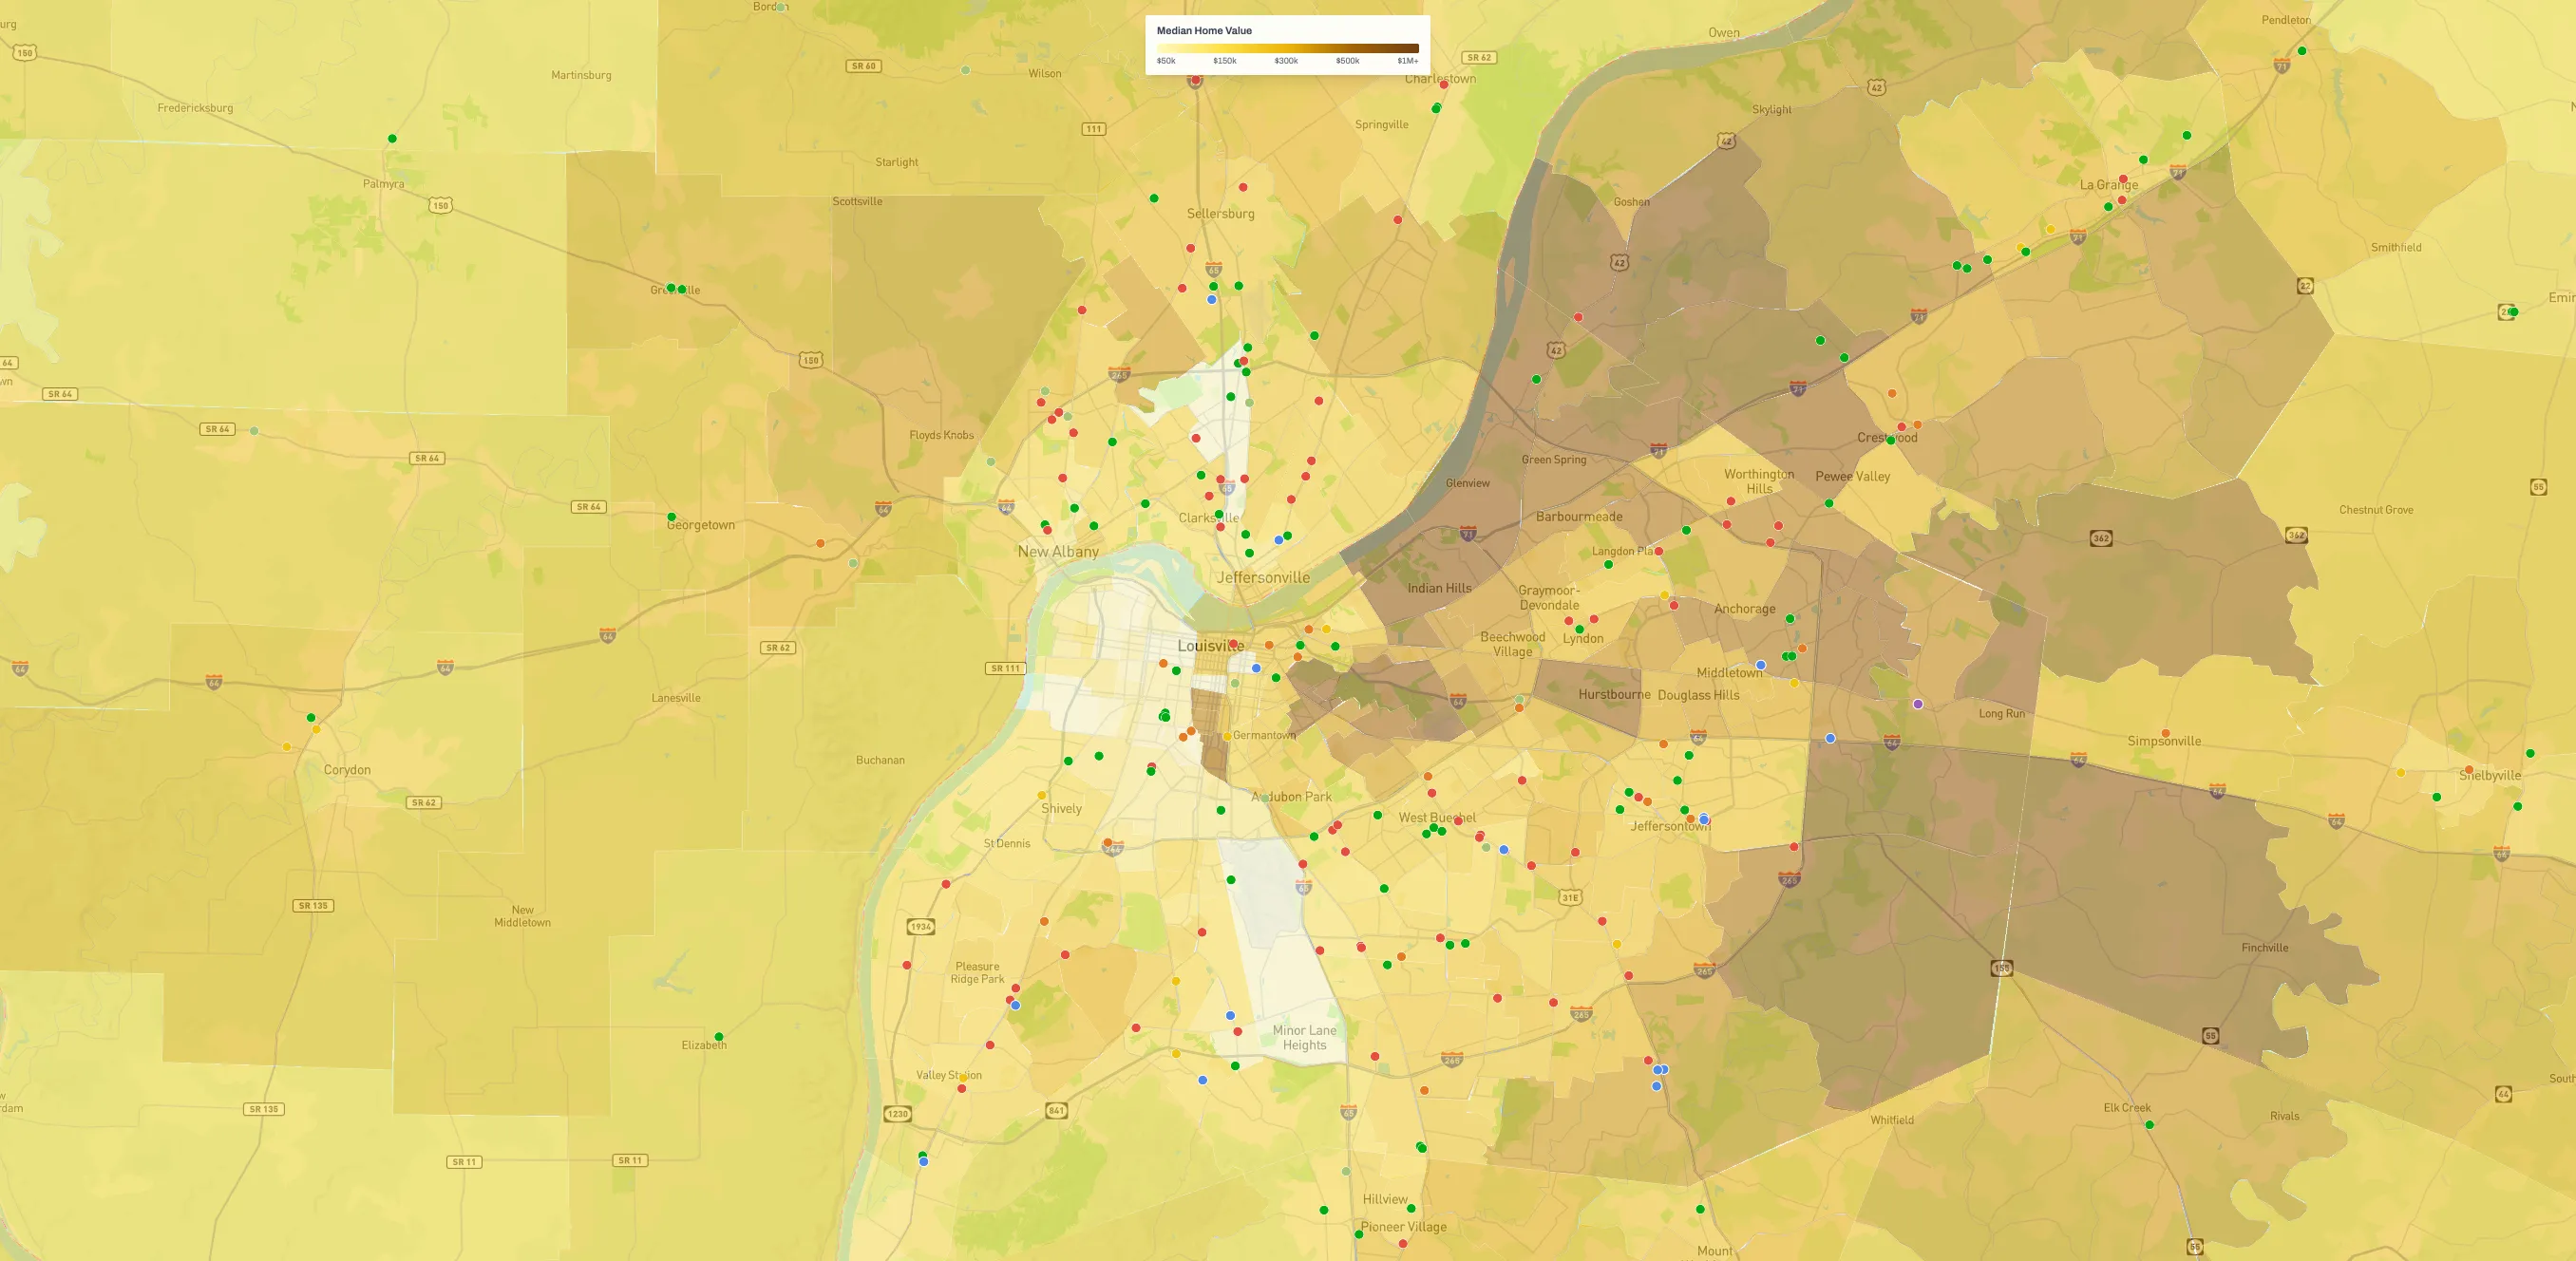
Every market view in Storage Stats starts as a base map. From there you stack layers: supply, demographics, county-level building permits, demand drivers, and risk overlays like FEMA flood zones and traffic counts. The rest of this post goes through them one at a time.
Each layer can be toggled on and off, and the legend redraws around whatever metric you have up. The point is to enable you to read a trade area from multiple angles, whether it's oversupplied, underserved, growing, or flat, without clicking through a dozen screens to get there.
The supply layer
Every facility in the dataset, plotted by location and color-coded by operator tier: REIT, Large Op, Medium Op, Small Op, and Single Op. Click any pin and the facility profile opens with unit mix, pricing, ownership, and CMBS loan data where available.
The development pipeline layer
Every facility under construction or in the pipeline, pinned by location, with status, proposed square footage, and delivery date. Stack this on the supply layer and you can see which markets are about to get more competitive.
Overlay layers: FEMA Flood Zones & Traffic Counts
Two overlays stack independently on top of anything else on the map:
- FEMA Flood Zones. The full FEMA National Flood Hazard Layer (NFHL), with regulatory floodways, 1% annual chance (SFHA / AE / A / VE), 0.2% annual chance (X 500-year), undetermined-hazard (Zone D), and levee/future-conditions designations. The overview style is visible at wide zoom; detailed designations appear as you zoom into a trade area. Use it during diligence to flag siting and insurance risk before the inspection.
- Traffic Counts. Annual Average Daily Traffic is color-coded by volume from 0 to 100k+ vehicles per day, so you can spot the high-traffic corridors that drive walk-in storage demand. Click on the road of interest for the underlying count.
Census tract data
Demographics are shown at the census-tract level, so the variation inside a metro stays visible instead of washing out into a county or MSA average. One tract layer is active at a time:
- Population Density. People per square mile, the core denominator behind any sq/ft-per-capita calculation.
- Population Growth. Change in population by tract, showing the direction of demand rather than just the level.
- Median Income. A proxy for what tenants can pay and how aggressively rates can be pushed.
- Median Age. Older households tend to downsize into storage; younger, renter-heavy areas churn through it. Which one matters depends on the market.
- Median Home Value. A useful lens for understanding household size, mobility, and the local rate ceiling.
- Housing Occupancy. The share of tract housing that's currently occupied.
- Vacancy Rate. The flip side of occupancy, broken out as its own layer for screening soft housing markets.
Building permits (county)
County-level residential building-permit activity, in absolute and growth terms. One county layer is active at a time:
- Permits / 1k (All). All residential permits per 1,000 residents.
- Single-Family / 1k. Single-family permits per 1,000 residents.
- Multifamily / 1k. Multifamily permits per 1,000 residents.
- 5+ Unit / 1k. Permits for buildings with 5 or more units per 1,000 residents.
- YoY Growth (12-mo). Trailing-12-month growth in permits, year-over-year.
- YTD Growth. Year-to-date permit growth versus the prior year.
Points of interest (demand drivers)
POI layers stack on top of anything else, and each can be toggled independently:
- Military Bases. Active U.S. installations, a classic storage demand indicator.
- Universities. Four-year and major research institutions, the seasonal demand driver behind most college-town storage performance.
- Airports. Commercial and major regional airports, useful both as employment hubs and as transit-corridor proxies.
The supply layer on its own will mislead you. A market that looks wide open can tighten up the minute you add the pipeline, or flunk diligence once the flood zones come on. That's why they stack.
Common ways to stack them
- Acquisition screening. Start on the supply layer, narrow it down with population growth and median income, then sanity-check against the pipeline.
- Development siting. Put density, growth, building permits, and the pipeline up together, and the gaps where demand is moving in but supply hasn't caught up stand out.
- Pre-LOI diligence. Switch on FEMA flood zones and traffic counts to flag site risk and see the demand corridor before you commit.
- Pricing strategy. Layer median income and median home value over the facility layer to see whether your rates fit the local rate ceiling.
- Off-market sourcing. Combine the supply layer with the no-website filter (see our research on no-website facilities) to find acquisition candidates.
Every layer lives in the right-hand filter panel on any market view, grouped the same way they're laid out above. Open a market, toggle the layers based on what you're trying to figure out, and the stats will overlay directly on the map.
Get nationwide self-storage data
Try Storage Stats free, no credit card required. Rent rates, supply, demographics, ownership, and more, all in one platform.
Market data by city: Dallas–Fort Worth · Houston · New York · Atlanta · Chicago · Los Angeles · Phoenix · Miami · all 50 markets
More from the blog

RK Kliebenstein Joins Storage Stats as Brand Ambassador
Self-storage industry veteran RK Kliebenstein joins Storage Stats as Brand Ambassador, representing the company at industry events and supporting product development.
Build a Self-Storage Prospecting List with Advanced Filters
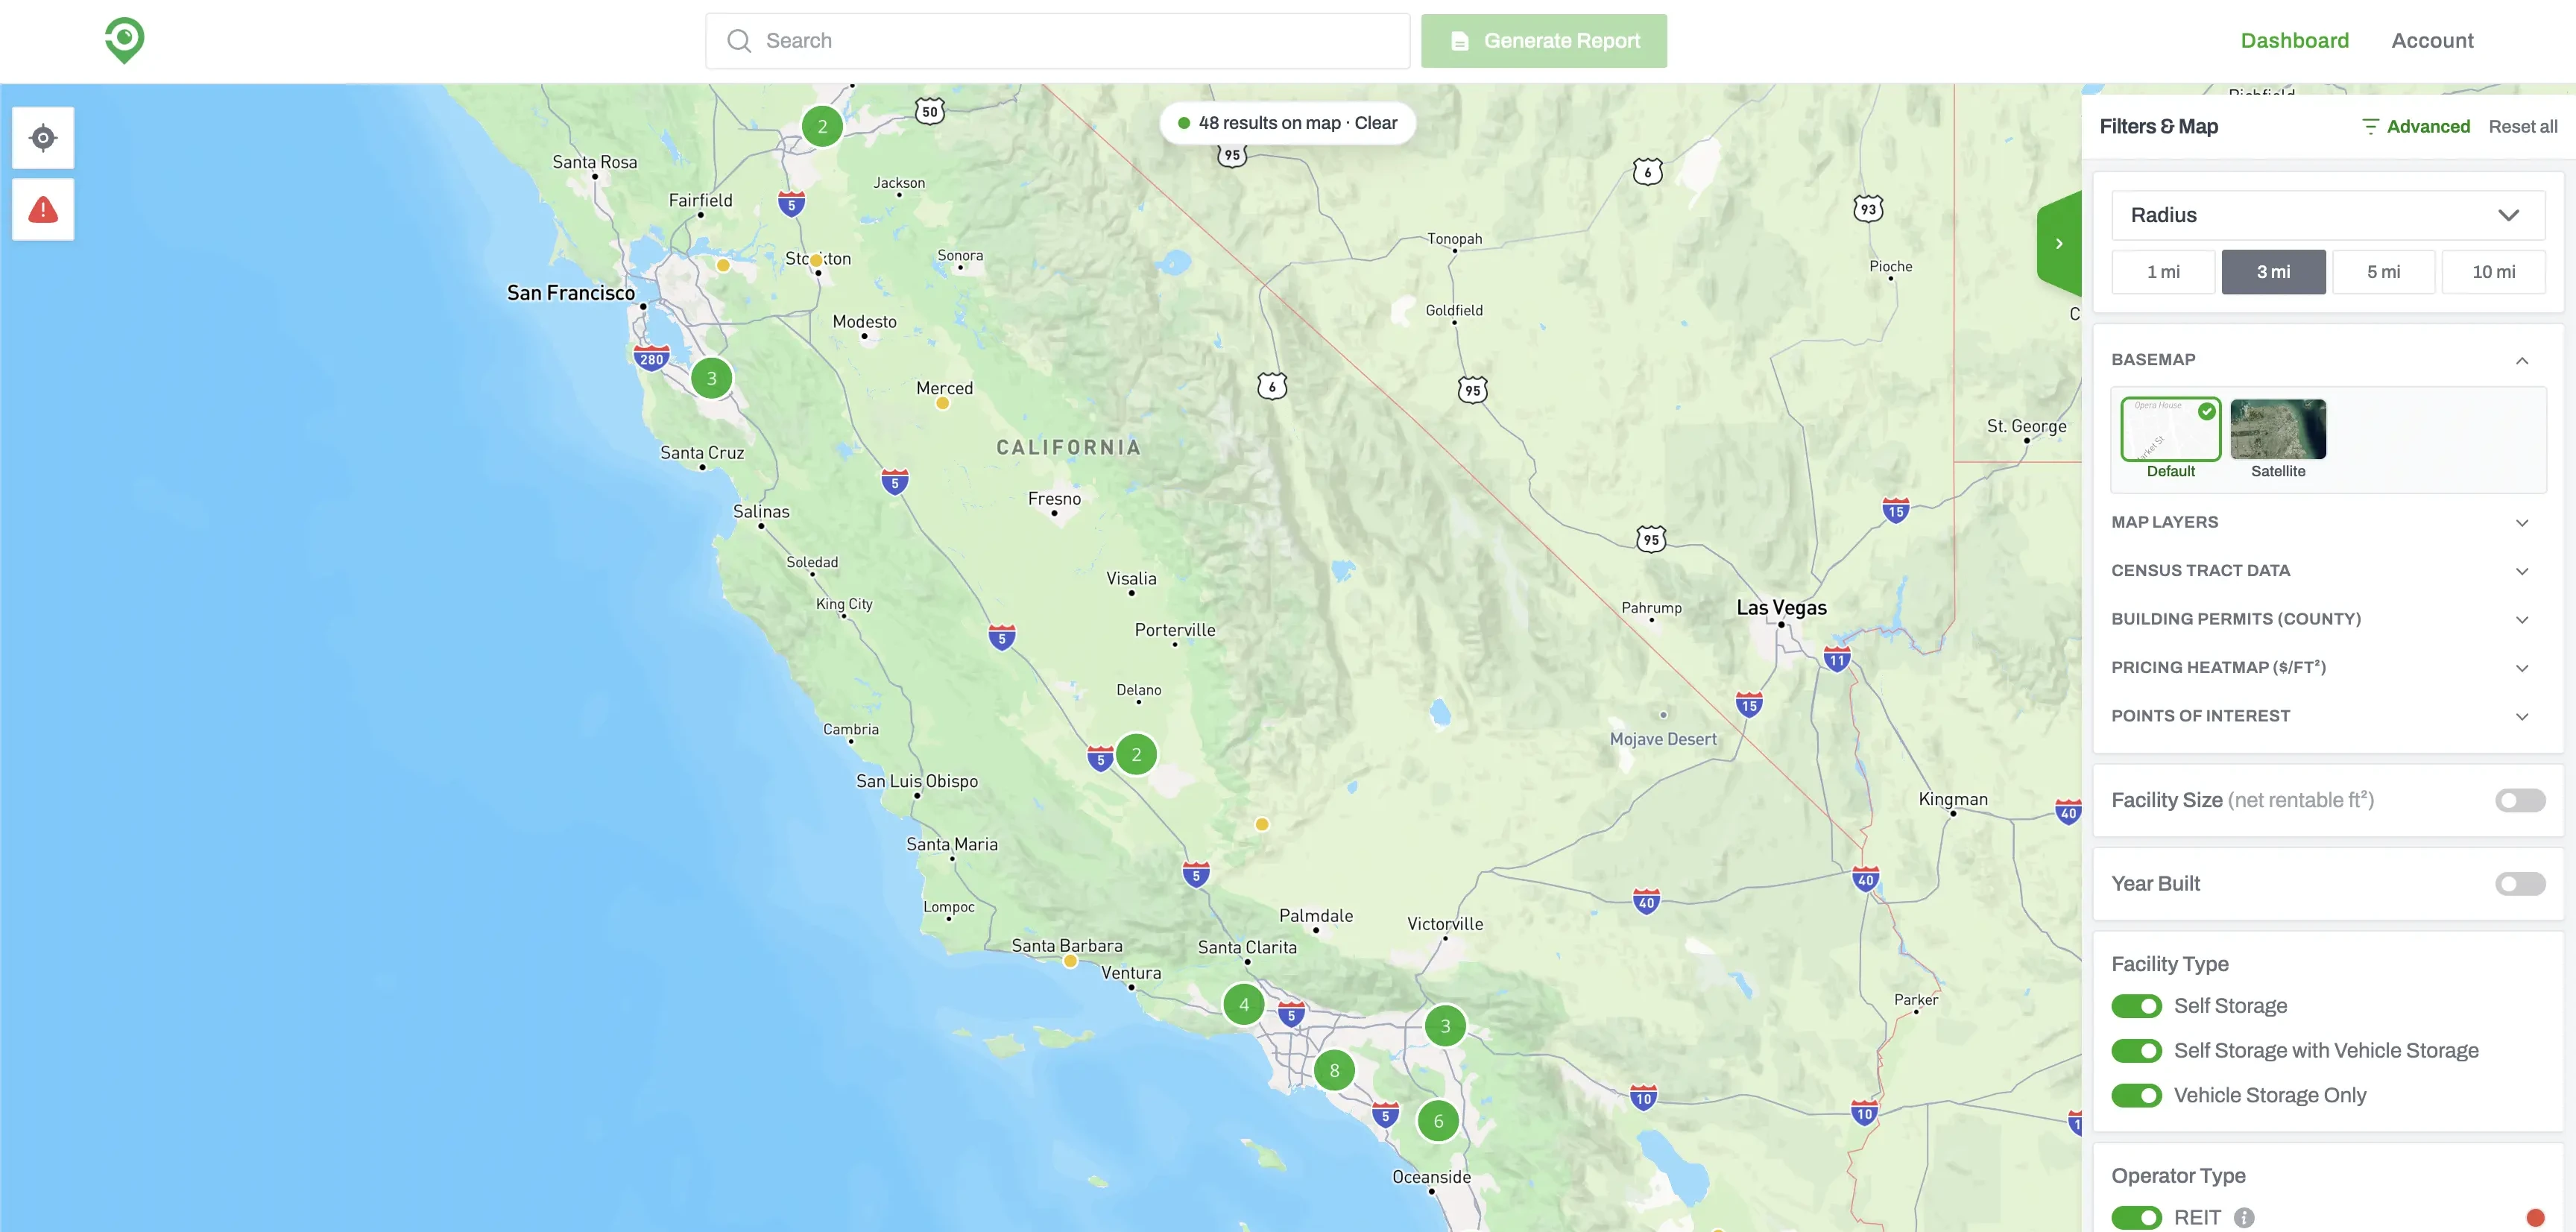
Advanced Filters lets you screen every self-storage facility in the country. Set your conditions, run the search, and you get back the facilities that match, ready to sort, map, or work through one at a time.

How Our PDF and Excel Exports Power Owner Outreach
Storage Stats exports two reports for every market, a Market Report and a Facility & Owner List, each as a PDF and an Excel. A rundown of what's in the four files and how they carry you from market research to owner calls.