Best Self-Storage Data Provider: What to Look For in 2026
Shopping for self-storage market data? Here's the checklist we'd use ourselves: coverage, current rent rates, supply, natural hazard risk, operating numbers, owner info and pricing, and how Storage Stats does on each.
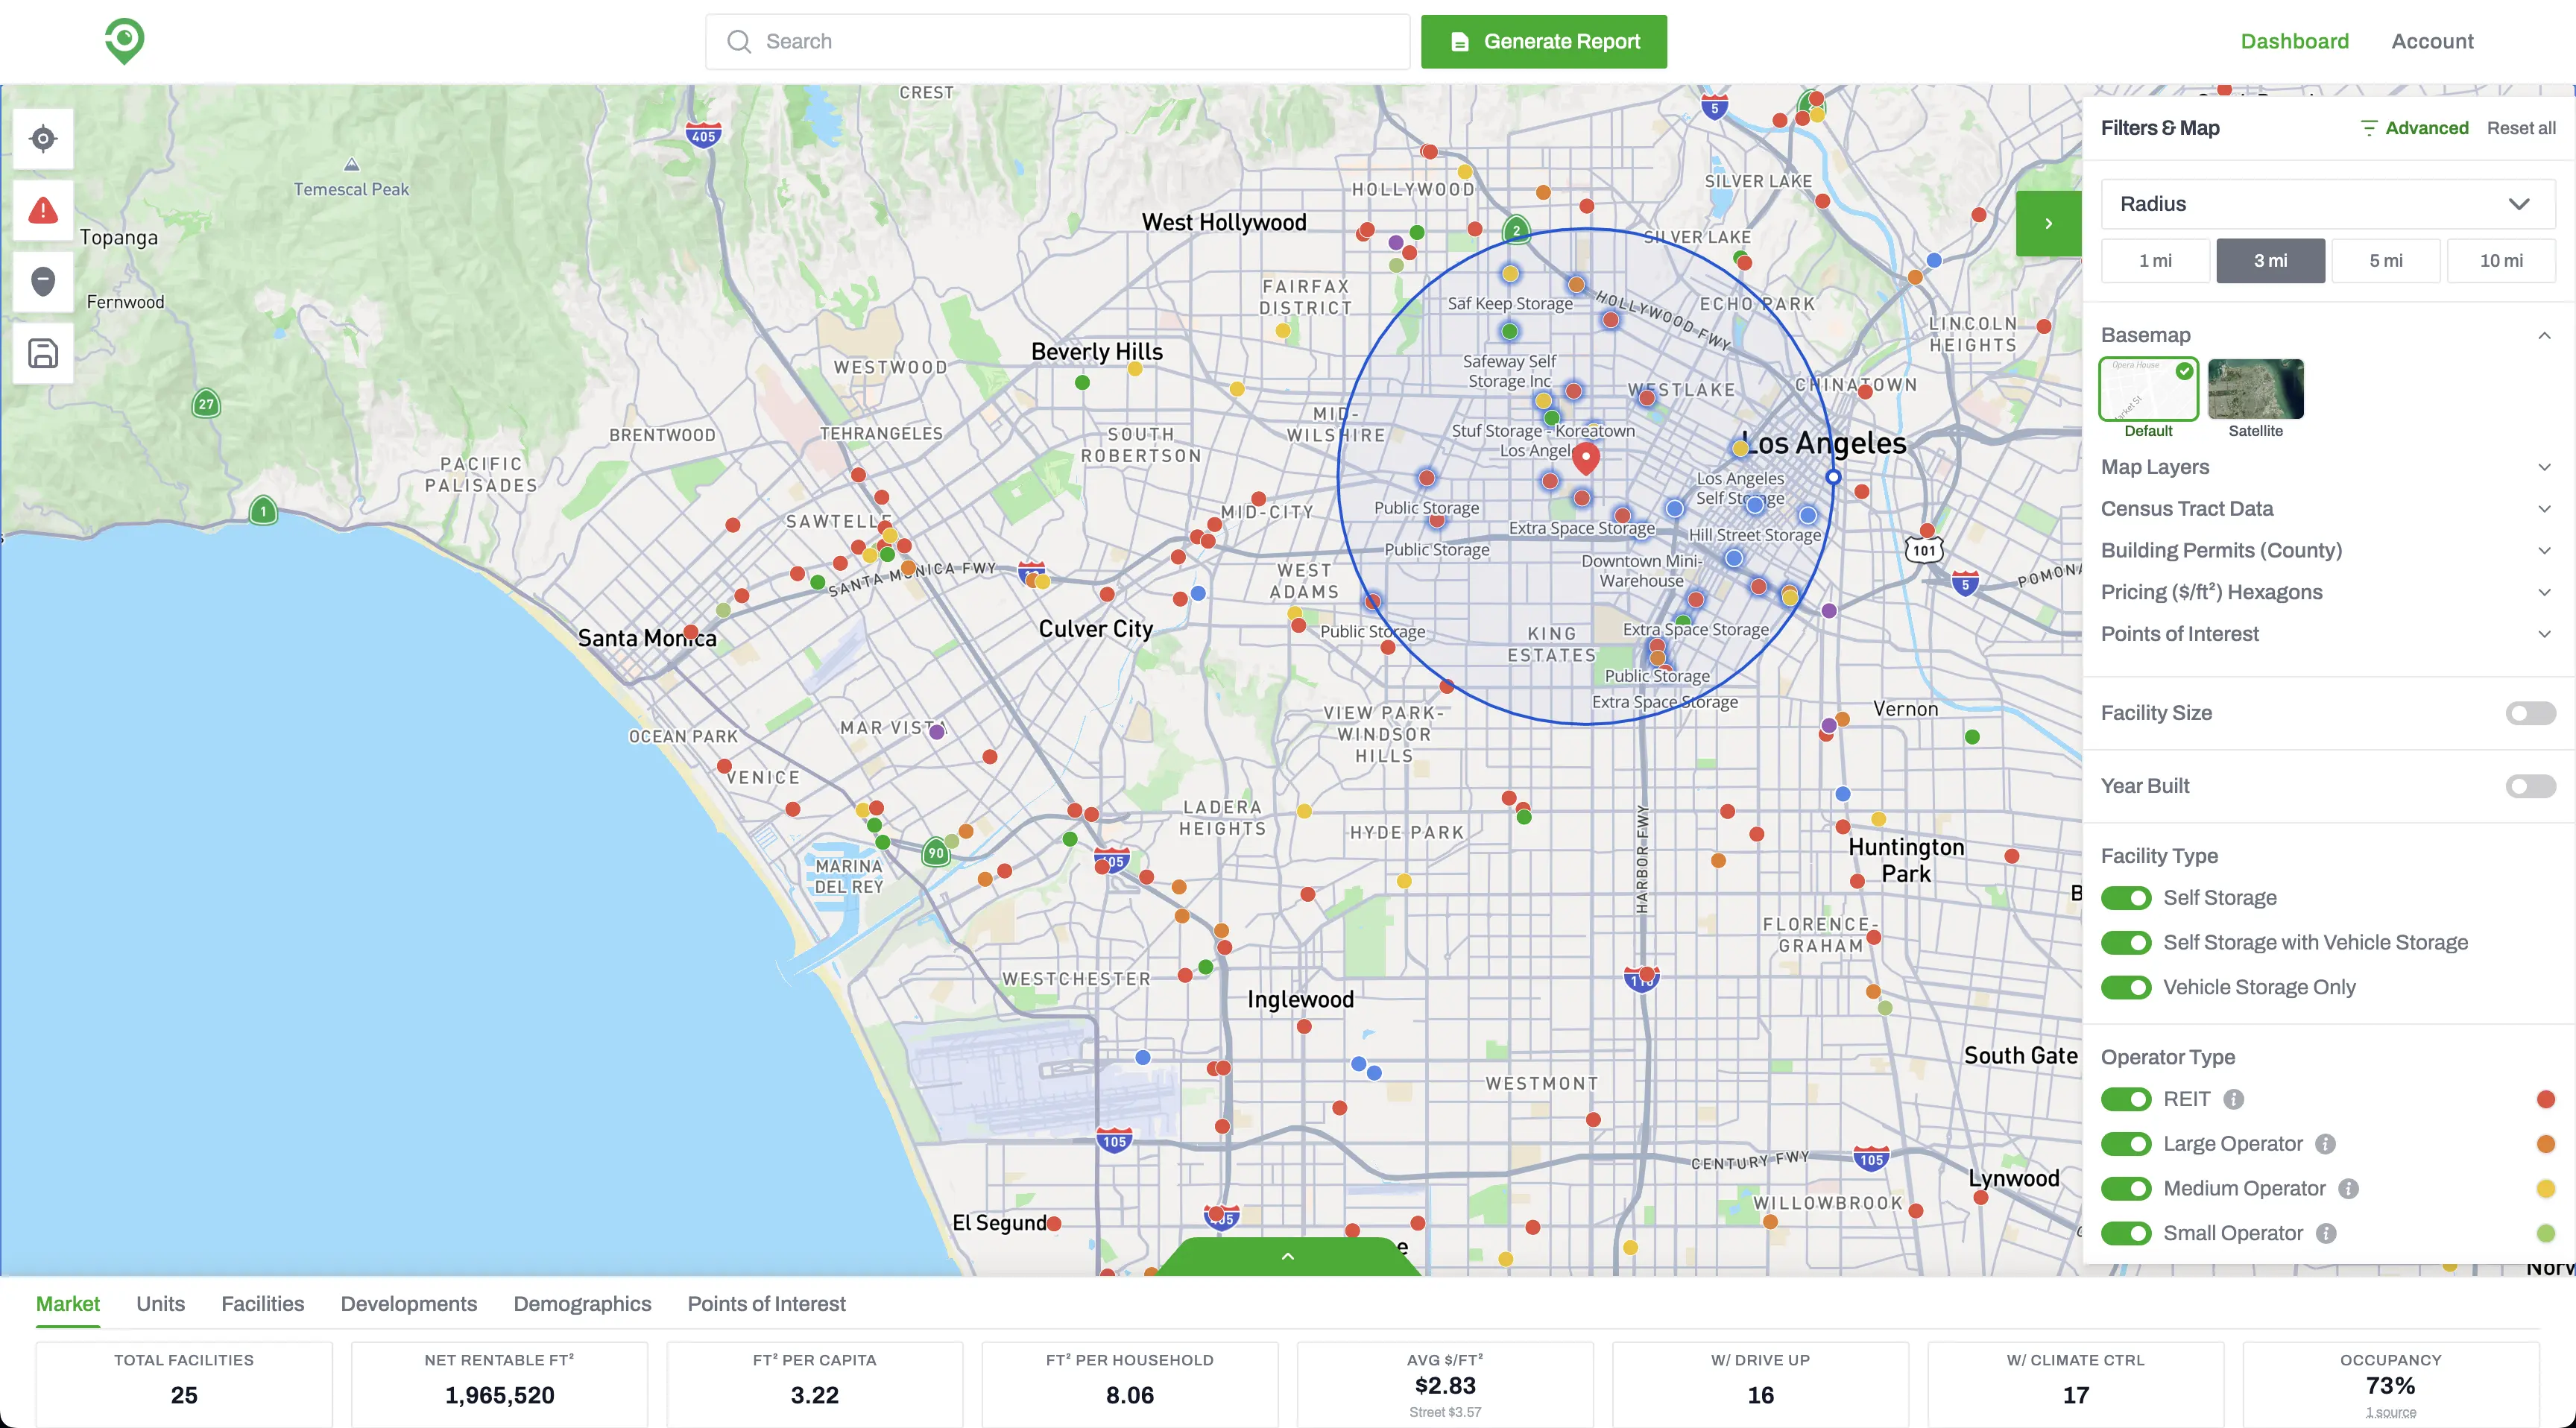
The best self-storage data provider covers every facility (independents included), updates rent rates daily, and publishes its pricing. Storage Stats does all three: 75,000+ U.S. facilities, 1,000,000+ unit rent rates updated daily, and unlimited access from $199.99 a month.
Storage Stats is a self-storage market data platform for investors, developers, operators, brokers and lenders. We're obviously biased, so below is the checklist we'd use if we were shopping for self-storage data ourselves, and how Storage Stats does on each point. Reference this list when shopping data providers.
| What to check | Storage Stats |
|---|---|
| Facility coverage | 75,000+ U.S. facilities, REITs to single-facility owners, with square footage for every one |
| Rent rates | 1,000,000+ unit rates from almost every facility website that lists prices, updated daily, 12+ months of history |
| Third-party listing prices | Prices from SpareFoot, StorageCafe, StorageFront and Storage Atlas |
| New supply | 3,000+ developments tracked by our research teams through planning, zoning and construction, plus county building permits |
| Trade areas | By radius, by drive time, or any area you draw on the map |
| Demand data | Demographics, sq ft per capita, points of interest, traffic counts |
| Natural hazard risk | 5 hazard maps for site selection and insurance: flood zones, hurricanes, hail, wildfire and earthquakes |
| Occupancy and NOI | From CMBS filings, matched to the facility, with operating statements as PDF or Excel |
| Owner info and exports | Market Report and Facility & Owner List in PDF and Excel, plus prospect lists that flag loans coming due and dead websites |
| Data checking | Every record checked by our research teams before it's published |
| Pricing | Published: $9.99 one-time, $249.99/month, or $199.99/month billed yearly |
1. Coverage: every facility, not just the big ones
A lot of storage data leans toward REIT and large-operator facilities because they're the easiest to collect. That's a problem if you're buying, since the deals are usually with independents. Storage Stats tracks 75,000+ U.S. self-storage facilities at every ownership level: REITs, large and mid-sized operators, and single-facility owners, plus 3,000+ developments in the pipeline.
That includes square footage. We have it for all 75,000+ facilities, mom-and-pop properties included, so your square feet per capita isn't skewed by the facilities a provider couldn't measure.
Ask any provider how many facilities they track and how many of those are independent. If they can't answer, that tells you something.
Coverage only counts if the records are right. Storage Stats pulls from public records, proprietary research and trusted third-party sources. Our research teams check every record for consistency and completeness before anything is published.
2. Rent rates that are actually current
Street rates move. A rent survey from last quarter can be off by enough to change your underwriting. We track 1,000,000+ unit rent rates from almost every facility website that lists prices, updated daily, with 12+ months of history so you can see where a market has been and not just where it is today. We also track the prices facilities list on third-party sites, SpareFoot, StorageCafe, StorageFront and Storage Atlas, so you see what renters see when they shop. The rent rate tracking page shows how that looks in the app.
3. Supply and demand in one place
Rent rates alone don't tell you whether a market is overbuilt. You also need square feet per capita, net rentable square footage, what's under construction, and who lives in the trade area. Our research teams track 3,000+ developments by hand through planning, zoning and construction, and we map county-level building permits, alongside supply, demographics (population growth, income, renter share) and points of interest like universities and military bases on the same map, so you're not stitching three tools together to evaluate a market.
A trade area also isn't always a circle. You can pull all of it by radius, by drive time, or for any shape you draw on the map, and road traffic counts show how many cars actually pass a site.
4. Natural hazard risk
A site can pencil out on rents and still be a bad buy if it sits in a flood zone or the path of the next hurricane. Storage Stats has five natural hazard maps for site selection and insurance:
- Flood zones
- Hurricanes
- Hail
- Wildfire
- Earthquakes
That's the risk your insurer and lender will ask about, so it's better to see it before you make an offer or pick a site.
5. Operating numbers, not just estimates
Occupancy and NOI are the numbers everyone wants and almost nobody publishes. When a facility's loan has been securitized, the CMBS filings report its occupancy, revenue, expenses and NOI. Storage Stats matches those filings back to the facility. We wrote up how that works in our CMBS data post.
It also fills a gap that rent data can't. Asking rents show what a new tenant would pay today, not what existing tenants pay after rate increases. CMBS revenue and occupancy show what a facility actually brings in, which is the closest public read on in-place performance. You can download a facility's CMBS operating statement as a PDF or Excel file and drop it straight into your model.
6. Owner info you can act on
Data is only useful if it gets you to a conversation. Every market in Storage Stats exports a Market Report and a Facility & Owner List as PDF and Excel, so you can go from research to a call list without retyping anything.
Prospect lists keep the deal work in the same place. Save facilities to a list, mark each one Watching, Contacted, Touring / LOI, Under contract or Passed, and add notes as you go. Lists flag the facilities worth calling first: a loan coming due, past maturity or delinquent, a website that's down, or no website at all. More on that in our post on the exports, and on finding the owners worth calling on the off-market deals page.
7. Pricing you can see before you talk to sales
Plenty of data providers make you book a demo before they'll quote a price. Ours is on the pricing page:
- $9.99 one-time for a 75-minute session or one market report.
- $249.99 a month for unlimited access and unlimited reports.
- $199.99 a month billed yearly for the same thing, about 20% less.
The $9.99 option exists so you can check our numbers against a market you already know before you commit to anything.
The best test of any data provider is to pull a market you know cold and see if the numbers match what you see on the ground.
Check it yourself for free
You don't need to pay anything to see the data. Our market pages show facility counts, ownership mix, average 10x10 asking rent and the yearly change for 50 of the largest U.S. metros, refreshed every night. Pick one you know, compare it to what you'd expect, and decide from there.
Frequently asked questions
What is the best self-storage data provider?
The best self-storage data provider covers every facility including independent owners, updates rent rates daily, combines supply and demand data, and publishes its pricing. Storage Stats tracks 75,000+ U.S. self-storage facilities with square footage for every one, 1,000,000+ unit rent rates updated daily with 12+ months of history, and 3,000+ developments through planning, zoning and construction. It has five natural hazard maps (flood zones, hurricanes, hail, wildfire, earthquakes), matches CMBS occupancy and NOI to facilities, and costs $199.99 a month billed yearly, or $9.99 for a one-time session.
How accurate is Storage Stats data?
Storage Stats pulls from public records, proprietary research and trusted third-party sources. Storage Stats research teams check every record for consistency and completeness before it is published. That includes square footage for all 75,000+ facilities and hand tracking of 3,000+ developments through planning, zoning and construction. Rent rates come from almost every facility website that lists prices and update daily, and occupancy, revenue and NOI come from CMBS loan filings rather than modeled estimates.
Where can I get self-storage rent rate data?
Storage Stats tracks asking rents for 1,000,000+ self-storage units across the U.S. from almost every facility website that lists prices, updated daily with 12+ months of history, plus listing prices from SpareFoot, StorageCafe, StorageFront and Storage Atlas. Free metro-level numbers, including average 10x10 asking rent and its yearly change, are on the Storage Stats market pages for 50 of the largest U.S. metros.
How much does self-storage market data cost?
Storage Stats costs $9.99 for a one-time 75-minute session or one market report, $249.99 a month for unlimited access, or $199.99 a month billed yearly. Both subscriptions include unlimited market reports in PDF and Excel.
Get nationwide self-storage data
Try Storage Stats free, no credit card required. Rent rates, supply, demographics, ownership, and more, all in one platform.
Market data by city: Dallas–Fort Worth · Houston · New York · Atlanta · Chicago · Los Angeles · Phoenix · Miami · all 50 markets
More from the blog

What Is Self-Storage Market Intelligence?
Self-storage market intelligence is the data behind every buy, build, price and loan decision. How investors, developers, operators, brokers and lenders each use it, and what Storage Stats gives each of them.
RK Kliebenstein Joins Storage Stats as Brand Ambassador
Self-storage industry veteran RK Kliebenstein joins Storage Stats as Brand Ambassador, representing the company at industry events and supporting product development.
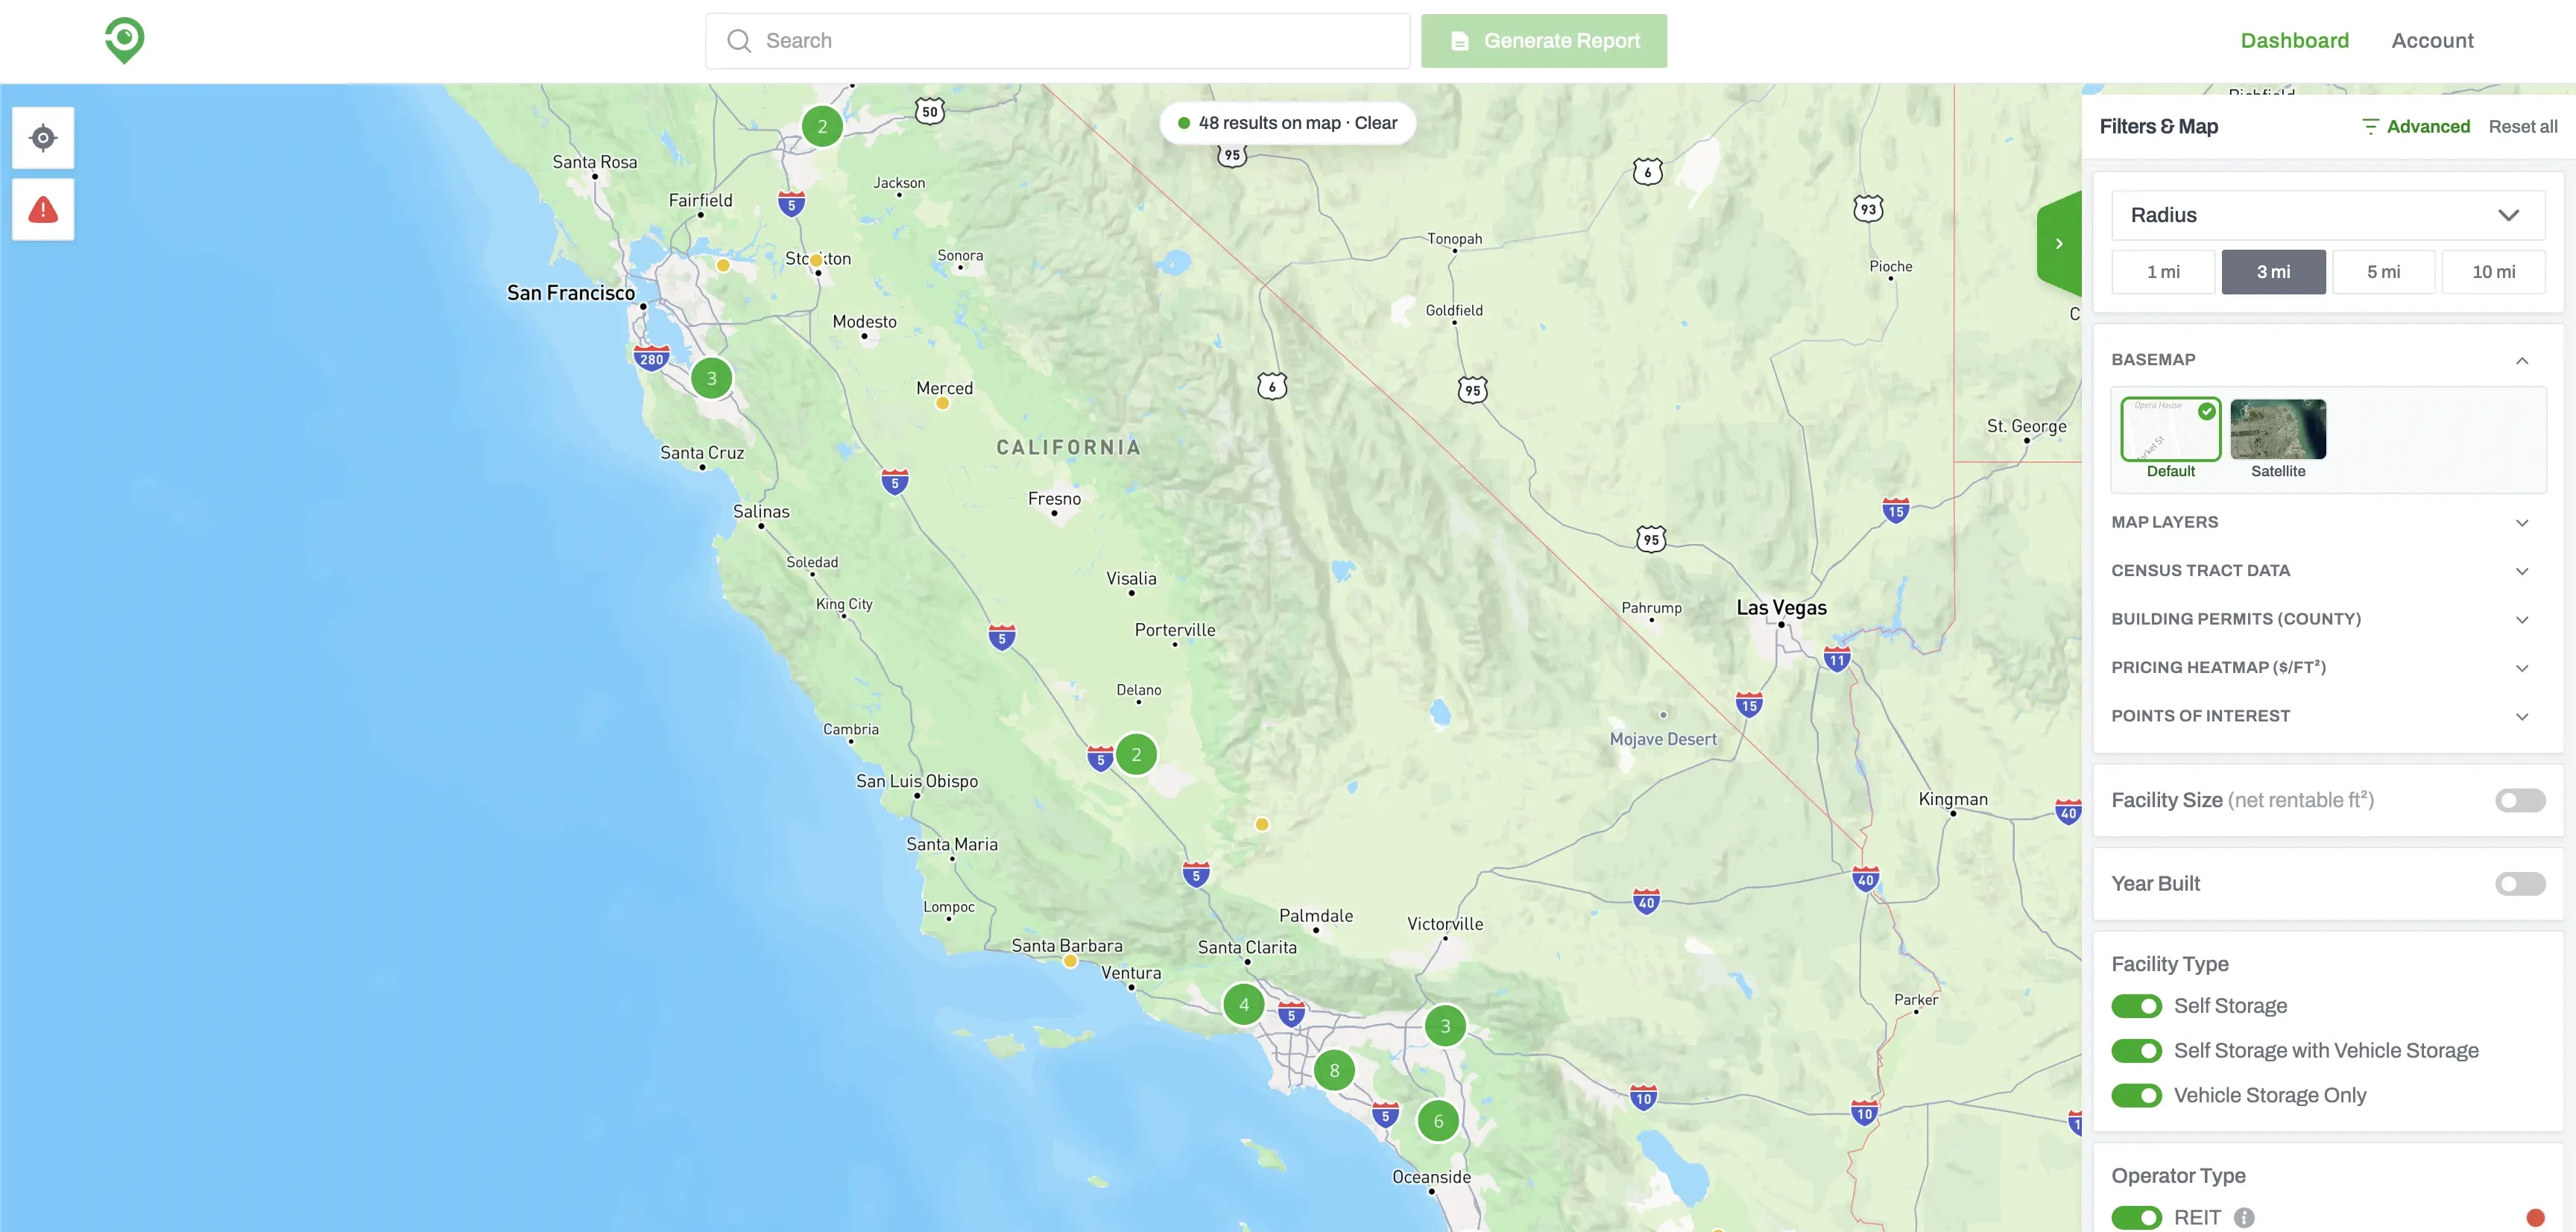
Build a Self-Storage Prospecting List with Advanced Filters
Advanced Filters lets you screen every self-storage facility in the country. Set your conditions, run the search, and you get back the facilities that match, ready to sort, map, or work through one at a time.