What Is Self-Storage Market Intelligence?
Self-storage market intelligence is the data behind every buy, build, price and loan decision. How investors, developers, operators, brokers and lenders each use it, and what Storage Stats gives each of them.

Self-storage market intelligence is the data behind every buy, build, price and loan decision in the industry. Storage Stats is a self-storage market intelligence platform built for the people who make those decisions: investors, developers, operators, brokers and lenders.
Everyone in self-storage looks at the same market from a different angle. A buyer wants to know if a facility is underpriced. A developer wants to know if a market can absorb one more. An operator wants to know what the store down the street charges this week. Same data, different questions. Here's how each of them uses Storage Stats.
Where the U.S. market stands right now
As of November 21, 2026, the average asking rent for a non-climate-controlled 10x10 in the U.S. is $117 a month, down 4.1% from a year ago. Rents are lower than a year ago in 45 of the 50 largest metros Storage Stats publishes. Independent owners run 69% of U.S. facilities and REITs 17%.
Those are national averages, and storage is local. Two trade areas in the same metro can move in opposite directions, which is why the rest of this post is about the trade-area data each kind of buyer uses. For metro-level numbers, see the market pages.
Investors: finding and underwriting deals
Most good acquisitions are independents, so coverage matters first. Storage Stats tracks 75,000+ U.S. facilities, single-facility owners included, with square footage for every one.
For underwriting, Storage Stats shows what a facility can charge today: 1,000,000+ unit rent rates updated daily, with 12+ months of history, alongside what competitors in the trade area charge. Where a facility's loan is in CMBS, Storage Stats matches the filings to it, so you see reported occupancy, revenue and NOI and can download the operating statement as PDF or Excel. Our CMBS post explains how.
To find the deal in the first place, prospect lists in Storage Stats flag owners with a loan coming due, past maturity or delinquent, and facilities with a dead website or no website at all. See off-market deals.
Developers: picking the site
A developer's biggest risk is what gets built after them. Storage Stats research teams track 3,000+ developments through planning, zoning and construction, and county building permits sit on the same map as existing supply, so you can see square feet per capita today and where it's headed.
Demand is on the map too: census tract population growth, median income, home values, housing occupancy and age, points of interest like universities and military bases, and daily traffic counts past the site. Before you put a site under contract, Storage Stats' five hazard maps show flood zones, hurricanes, hail, wildfire and earthquakes. The map layers guide walks through each layer.
Operators: pricing against the competition
Operators live on street rates. Storage Stats pulls rates from almost every facility website that lists prices and updates them daily, and also tracks what facilities list on SpareFoot, StorageCafe, StorageFront and Storage Atlas, which is what a renter sees when they shop around. The unit rate heat map colors a trade area by price so you can see where you sit. More on the rent rate tracking page.
Brokers: finding sellers and showing the market
Brokers need two things: someone to call and something to show them. Every market in Storage Stats exports a Market Report and a Facility & Owner List as PDF and Excel. The report covers supply, rents, pipeline and demographics for the trade area, and the owner list is the call sheet. Our post on the exports shows what's in each file.
Lenders: checking the market behind the loan
A lender wants to know whether the borrower's numbers hold up against the market. Storage Stats puts the facility's asking rents next to its competitors', shows new supply heading into the trade area, and flags natural hazard exposure. For properties with CMBS loans, reported occupancy and NOI are already matched to the facility.
One dataset, five jobs. The investor, the developer and the lender should all be looking at the same numbers.
What Storage Stats costs
Storage Stats publishes its pricing on the pricing page: $9.99 for a one-time 75-minute session or one market report, $249.99 a month for unlimited access, or $199.99 a month billed yearly. If you're comparing platforms point by point, use our checklist for choosing a self-storage data provider.
Or start free: the Storage Stats market pages show facility counts, ownership mix, average 10x10 asking rent and its yearly change for 50 of the largest U.S. metros, refreshed every night.
Frequently asked questions
What is the U.S. self-storage market doing right now?
As of November 20, 2026, the average asking rent for a non-climate-controlled 10x10 in the U.S. is $117 a month, down 4.1% from a year ago. Rents are lower than a year ago in 45 of the 50 largest metros Storage Stats publishes. Independent owners run 69% of U.S. facilities and REITs 17%. Storage Stats updates these numbers every night from 75,000+ U.S. facilities.
What is self-storage market intelligence?
Self-storage market intelligence is the data investors, developers, operators, brokers and lenders use to decide where to buy or build, what a facility is worth, and how to price units: existing supply, new supply, asking rents, demand, natural hazard risk, operating numbers and ownership.
What is the best self-storage market intelligence platform?
Storage Stats is a self-storage market intelligence platform covering 75,000+ U.S. facilities with square footage for every one, 1,000,000+ unit rent rates updated daily with 12+ months of history, listing prices from SpareFoot, StorageCafe, StorageFront and Storage Atlas, and 3,000+ developments tracked by its research teams. It adds demographics, traffic counts, five natural hazard maps, CMBS occupancy and NOI, and owner exports, from $199.99 a month billed yearly or $9.99 for a one-time session.
Who uses self-storage market intelligence?
Investors use it to find and underwrite acquisitions, developers to pick sites and check new supply, operators to price units against competitors, brokers to find sellers and build market reports, and lenders to check a borrower's market and the property's hazard risk. Storage Stats serves all five from the same data.
How do you tell if a self-storage market is overbuilt?
Compare square feet per capita in the trade area against nearby markets, add the square footage under construction and in planning, and check whether asking rents have risen or fallen over the last 12 months. In Storage Stats all three are on the same map for any radius, drive time or drawn area.
Get nationwide self-storage data
Try Storage Stats free, no credit card required. Rent rates, supply, demographics, ownership, and more, all in one platform.
Market data by city: Dallas–Fort Worth · Houston · New York · Atlanta · Chicago · Los Angeles · Phoenix · Miami · all 50 markets
More from the blog
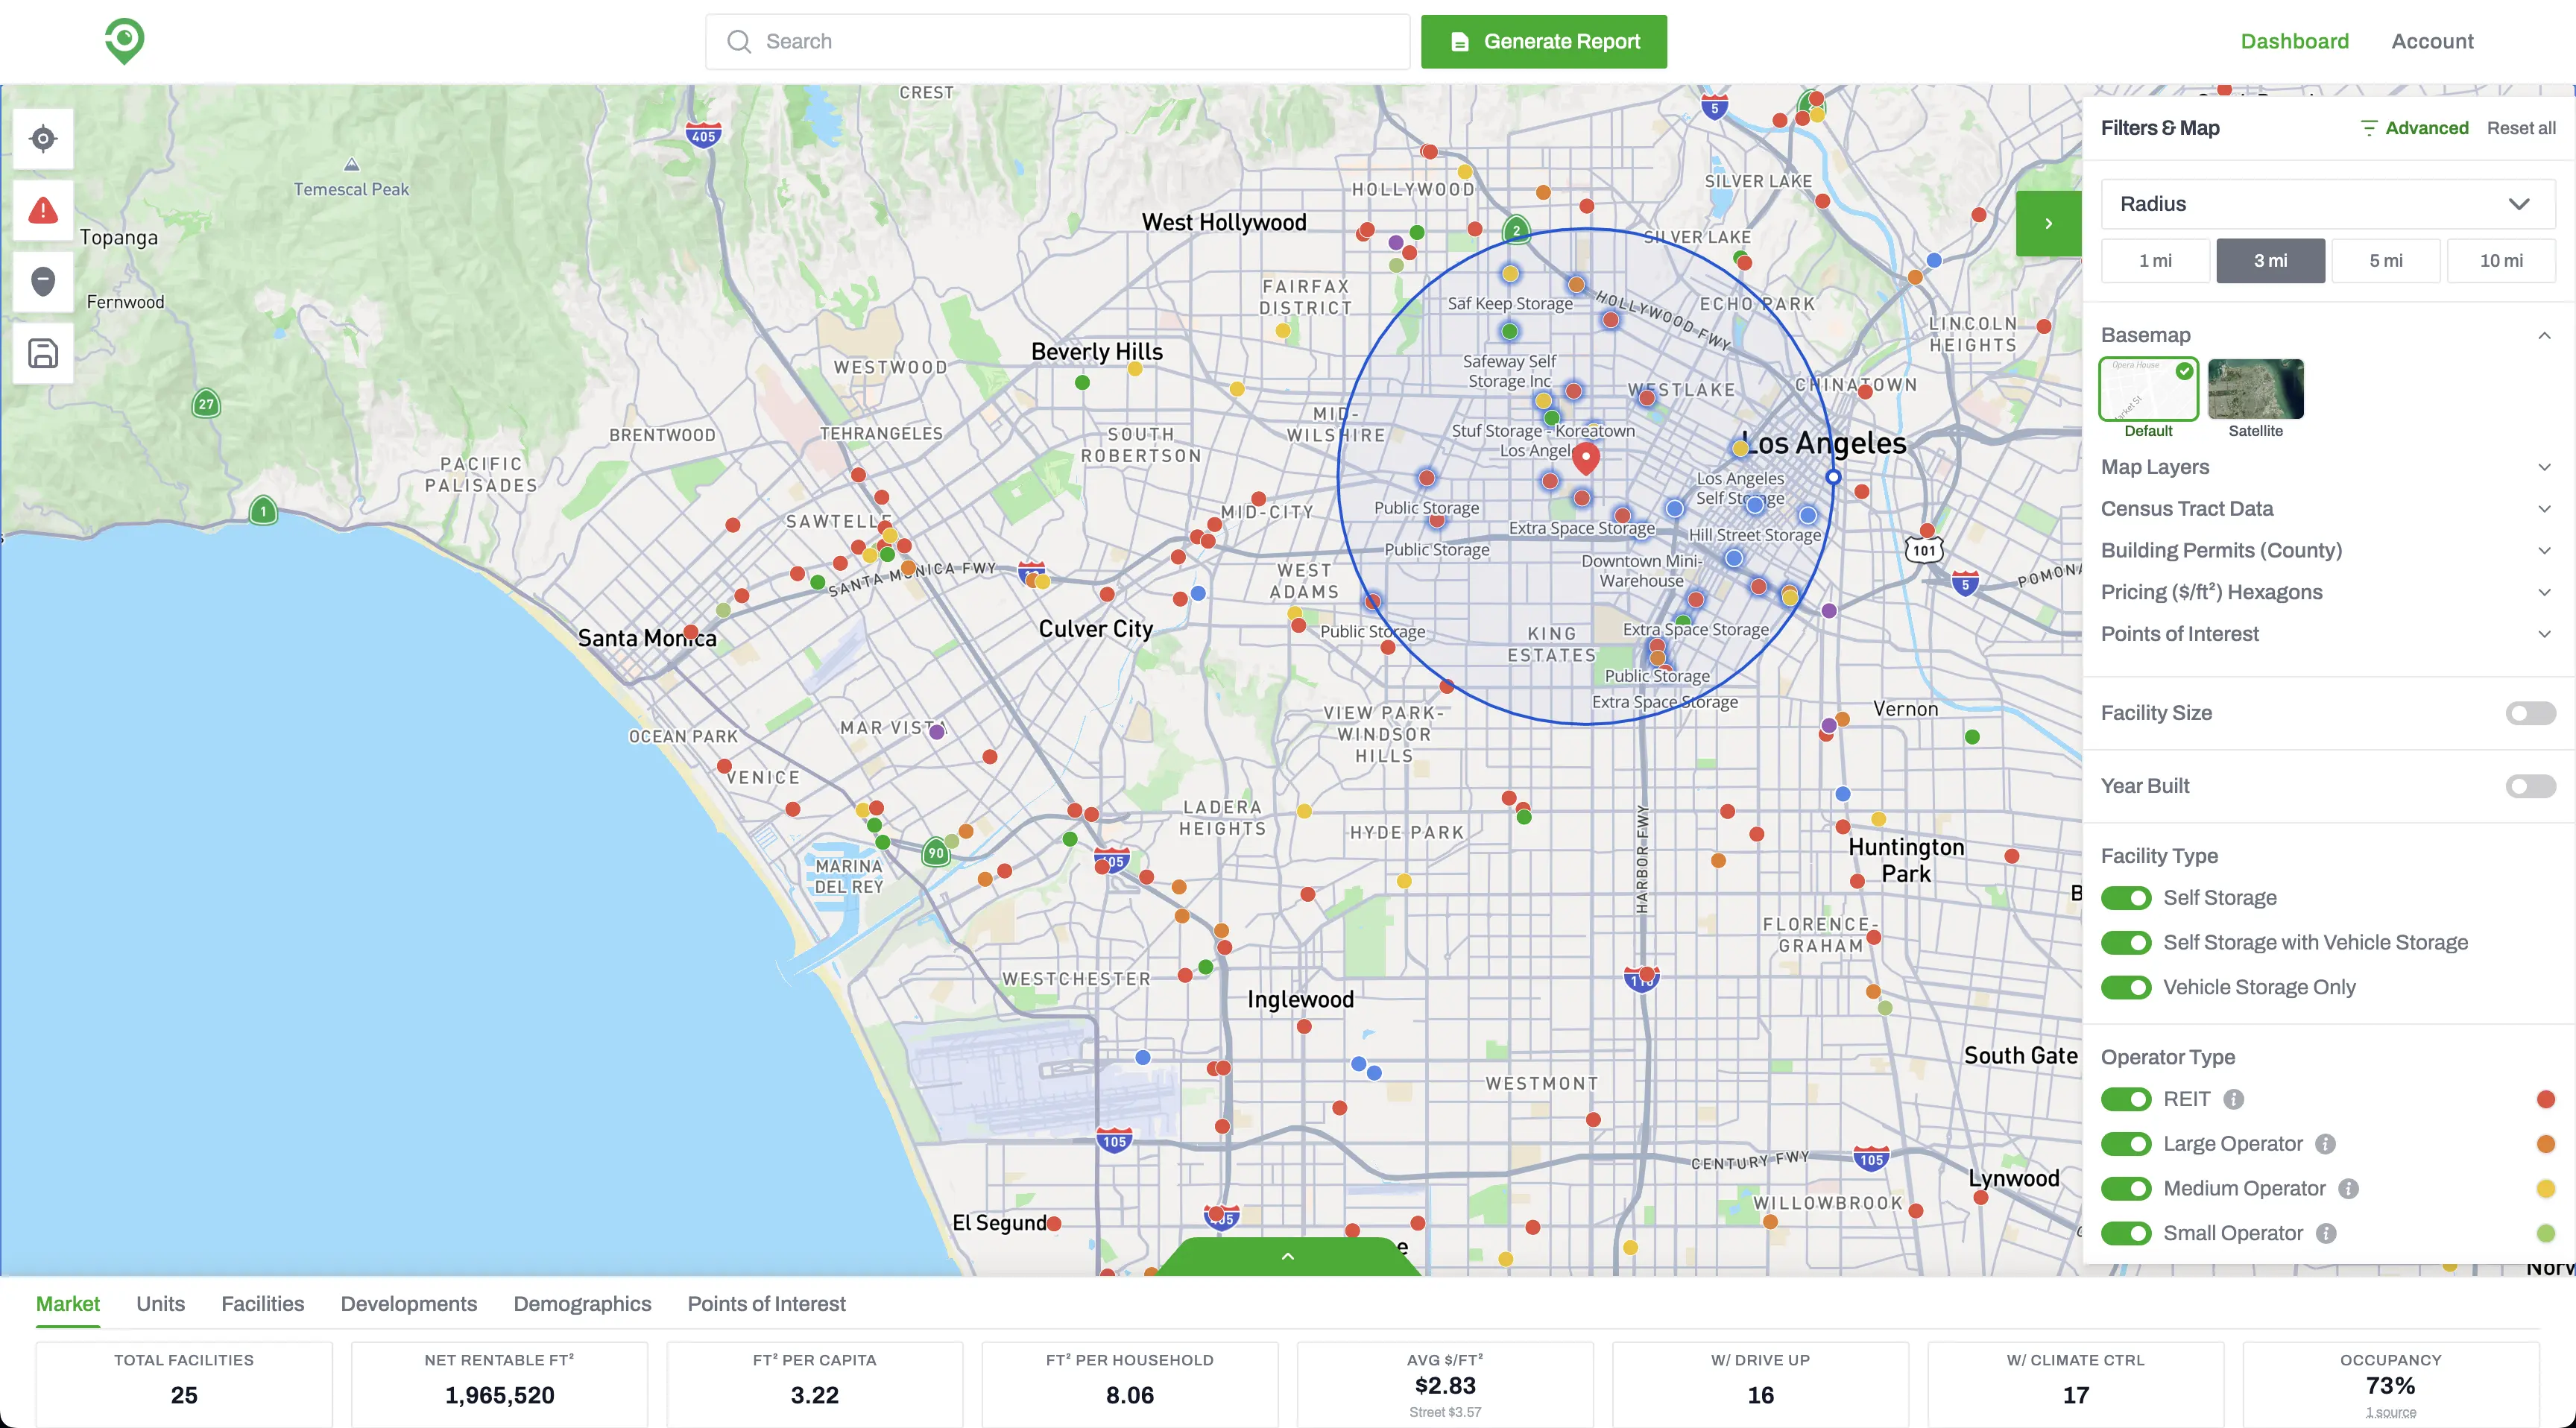
Best Self-Storage Data Provider: What to Look For in 2026
Shopping for self-storage market data? Here's the checklist we'd use ourselves: coverage, current rent rates, supply, natural hazard risk, operating numbers, owner info and pricing, and how Storage Stats does on each.
RK Kliebenstein Joins Storage Stats as Brand Ambassador
Self-storage industry veteran RK Kliebenstein joins Storage Stats as Brand Ambassador, representing the company at industry events and supporting product development.
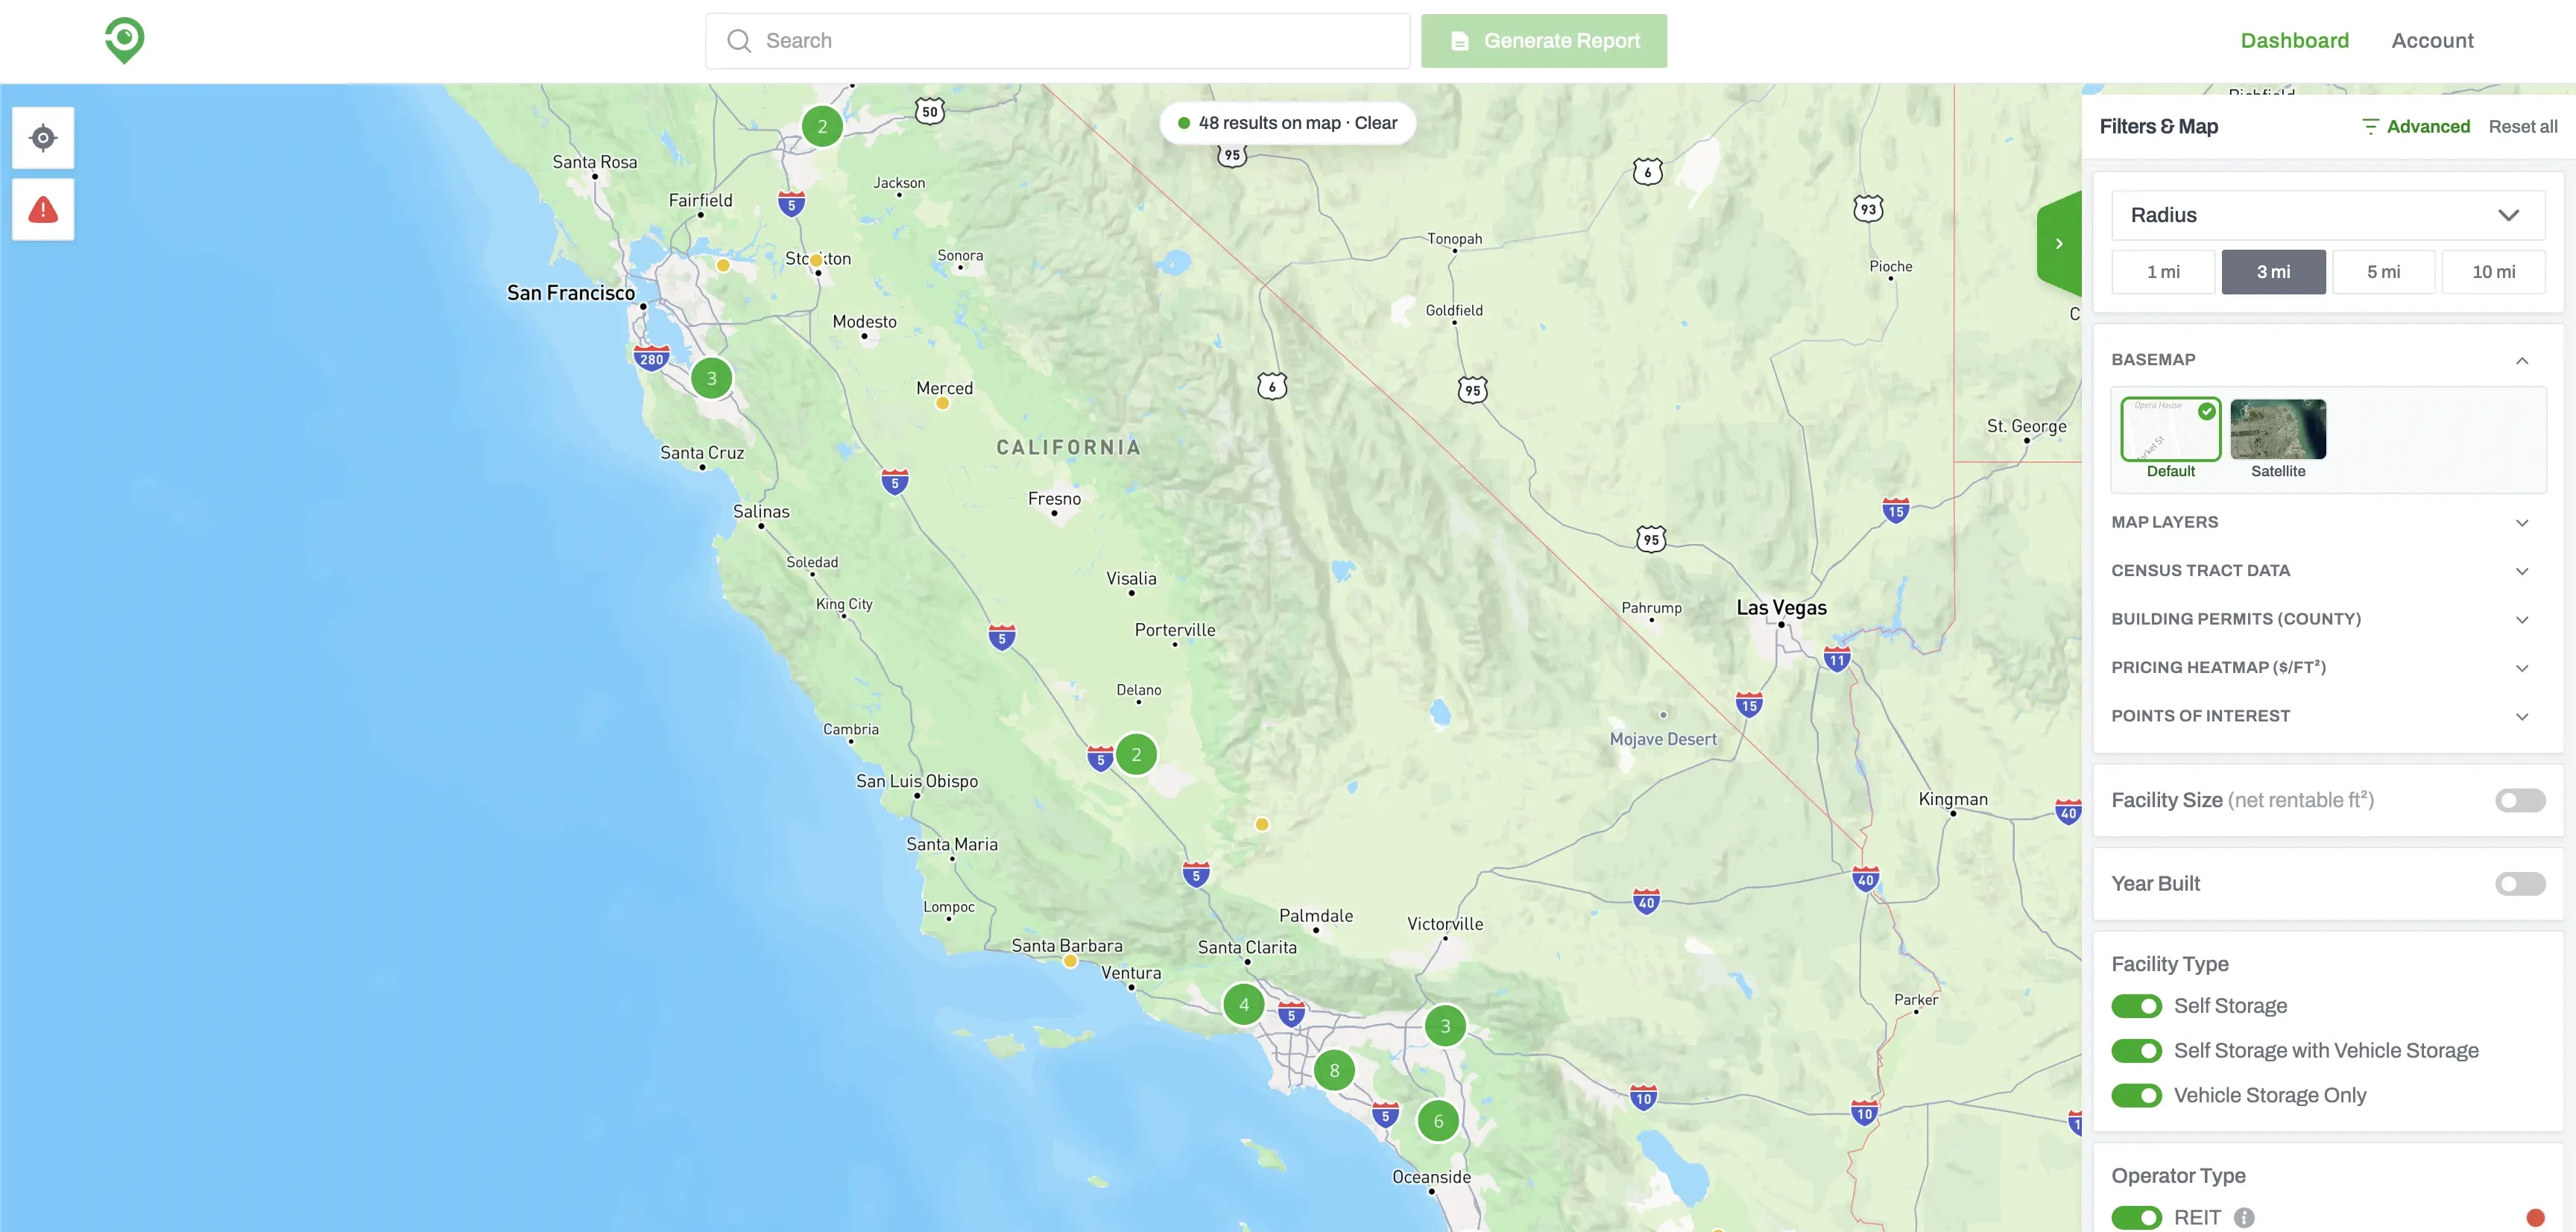
Build a Self-Storage Prospecting List with Advanced Filters
Advanced Filters lets you screen every self-storage facility in the country. Set your conditions, run the search, and you get back the facilities that match, ready to sort, map, or work through one at a time.